. Oven Amine1
Annenkov V.V., Zelinskiy S. N., Pal'shin V.A., Kyzmin A., Danilovtseva E.N. Fluorescein-based vital dye for silicifying organisms. Dyes and Pigments Volume 222, March 2024, 111838. DOI:10.1016/j.dyepig.2023.111838

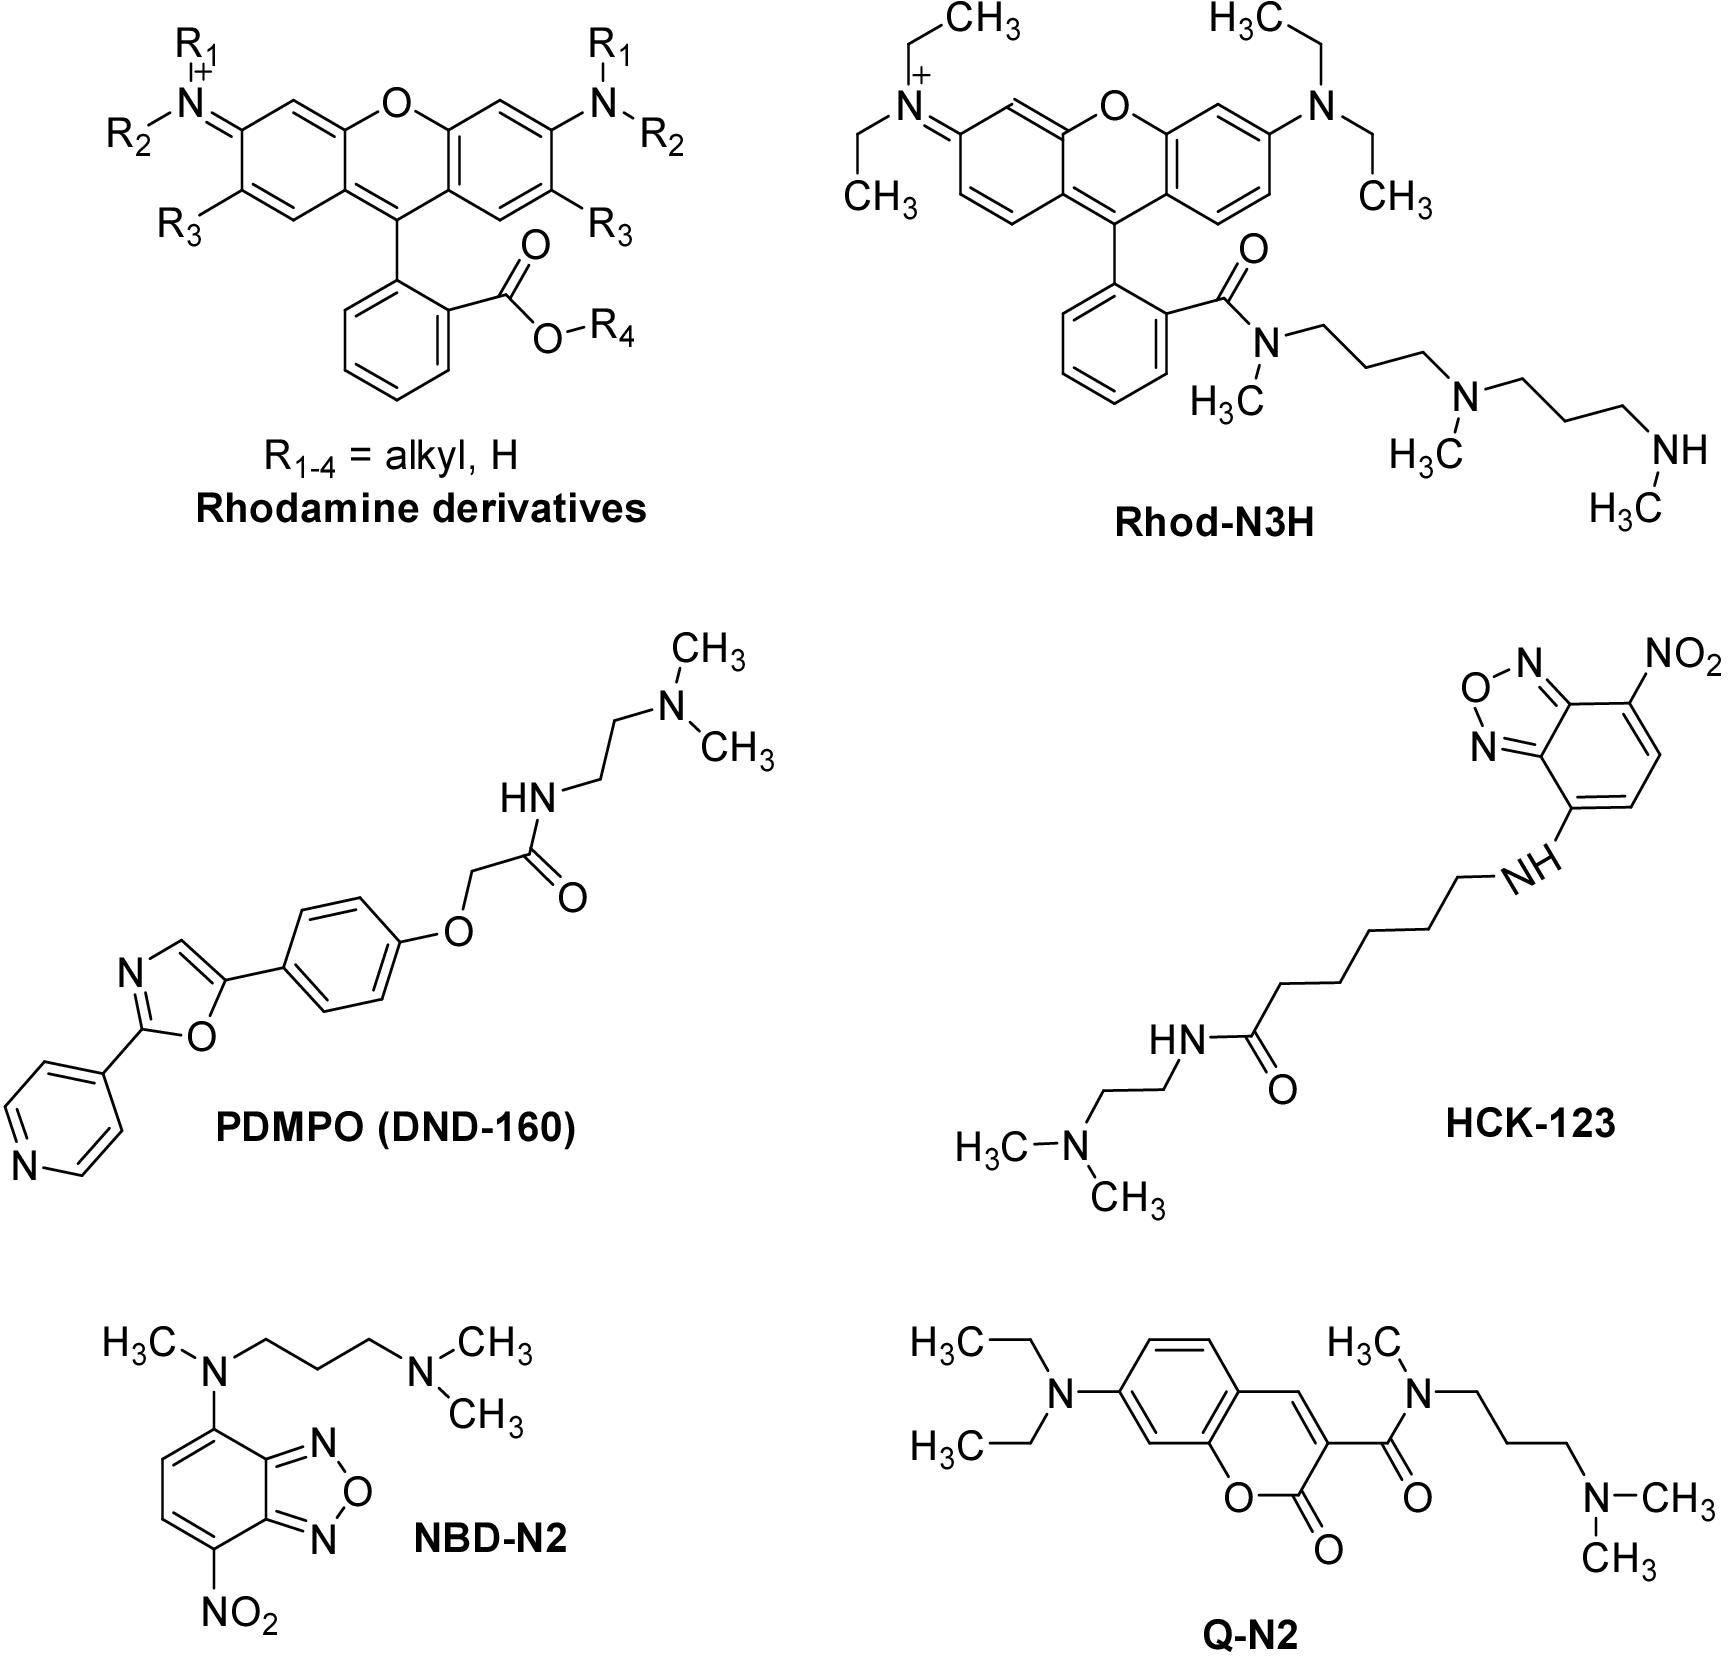
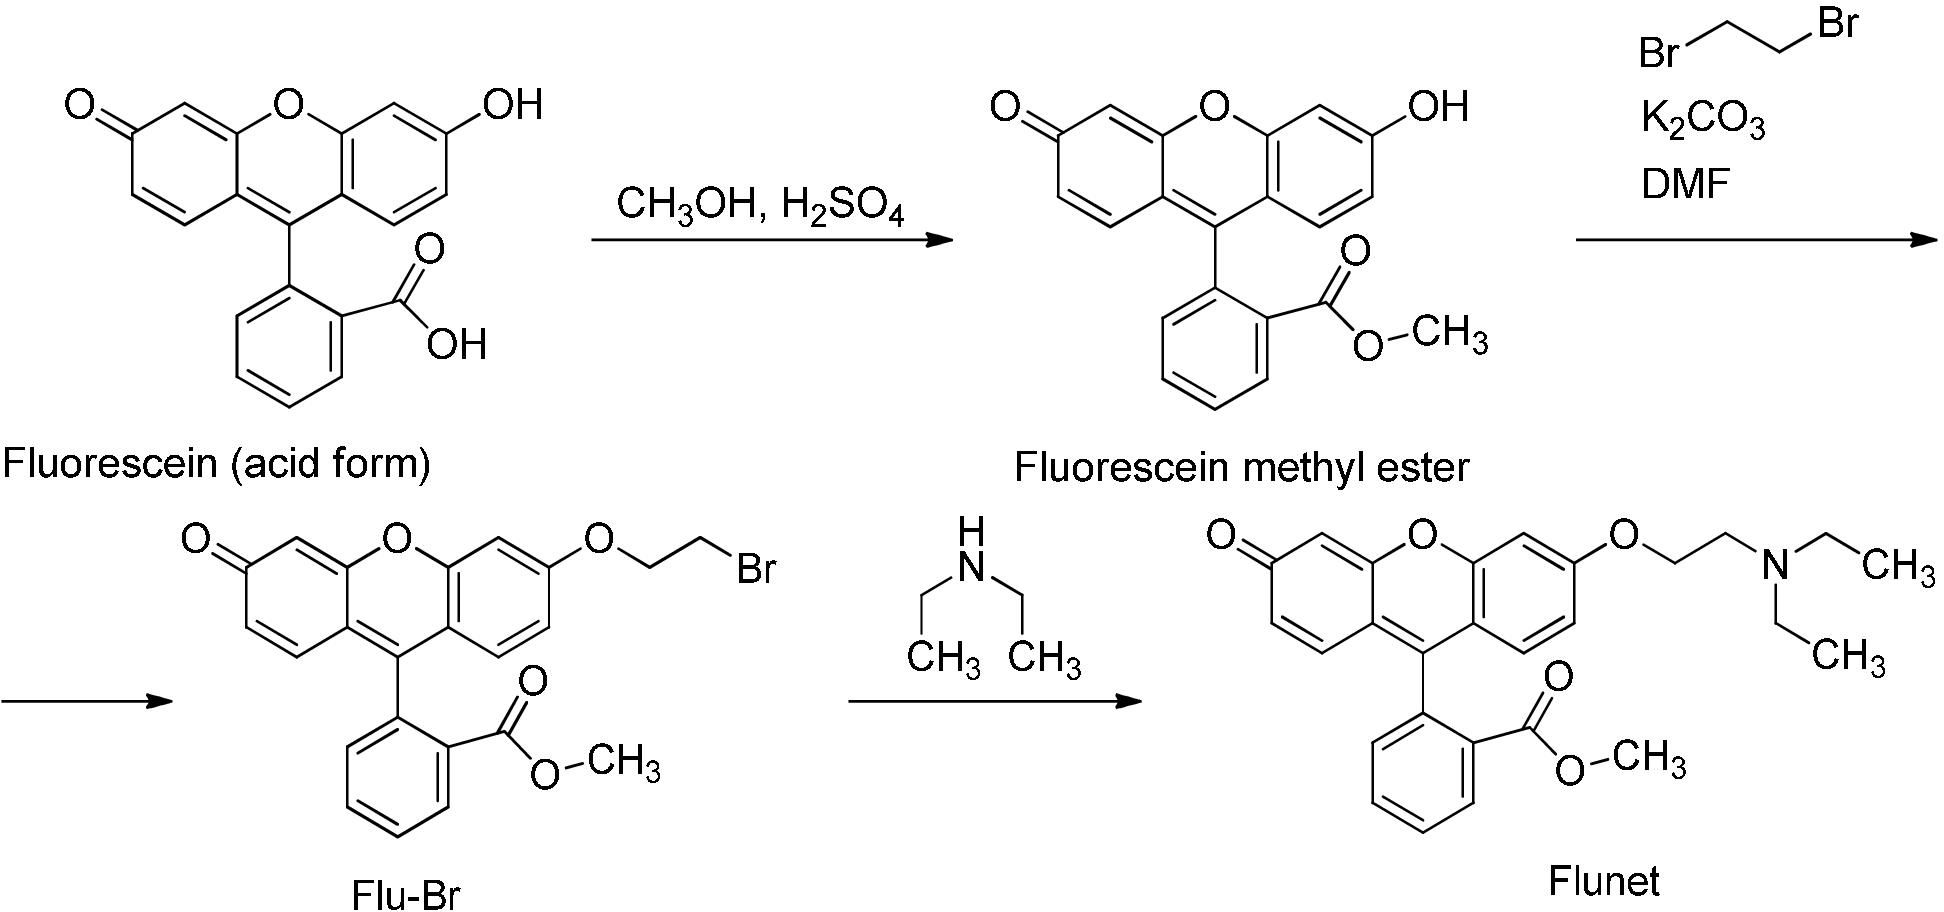
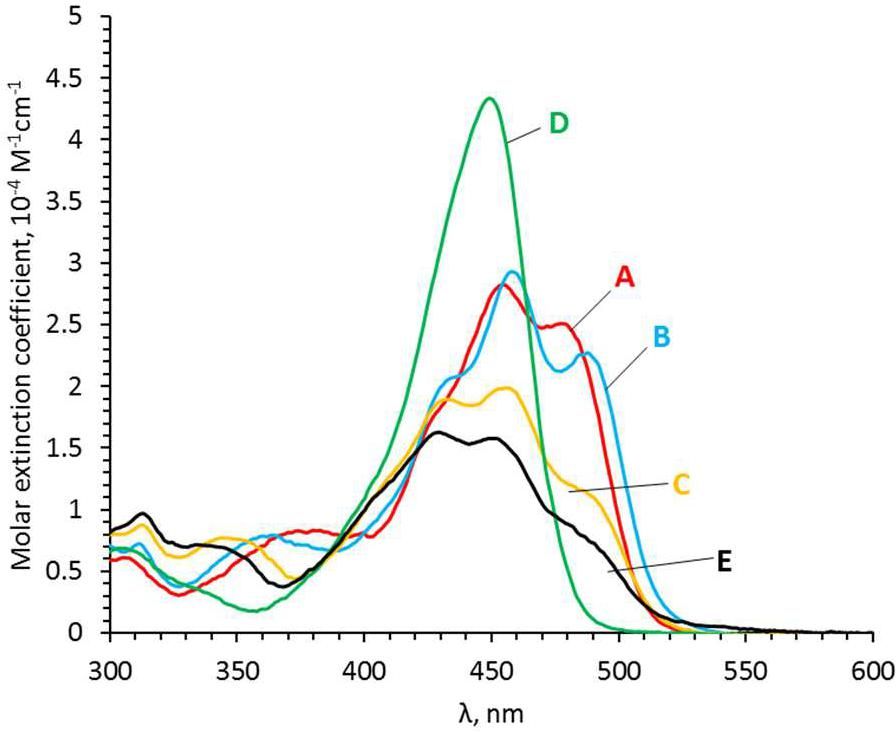
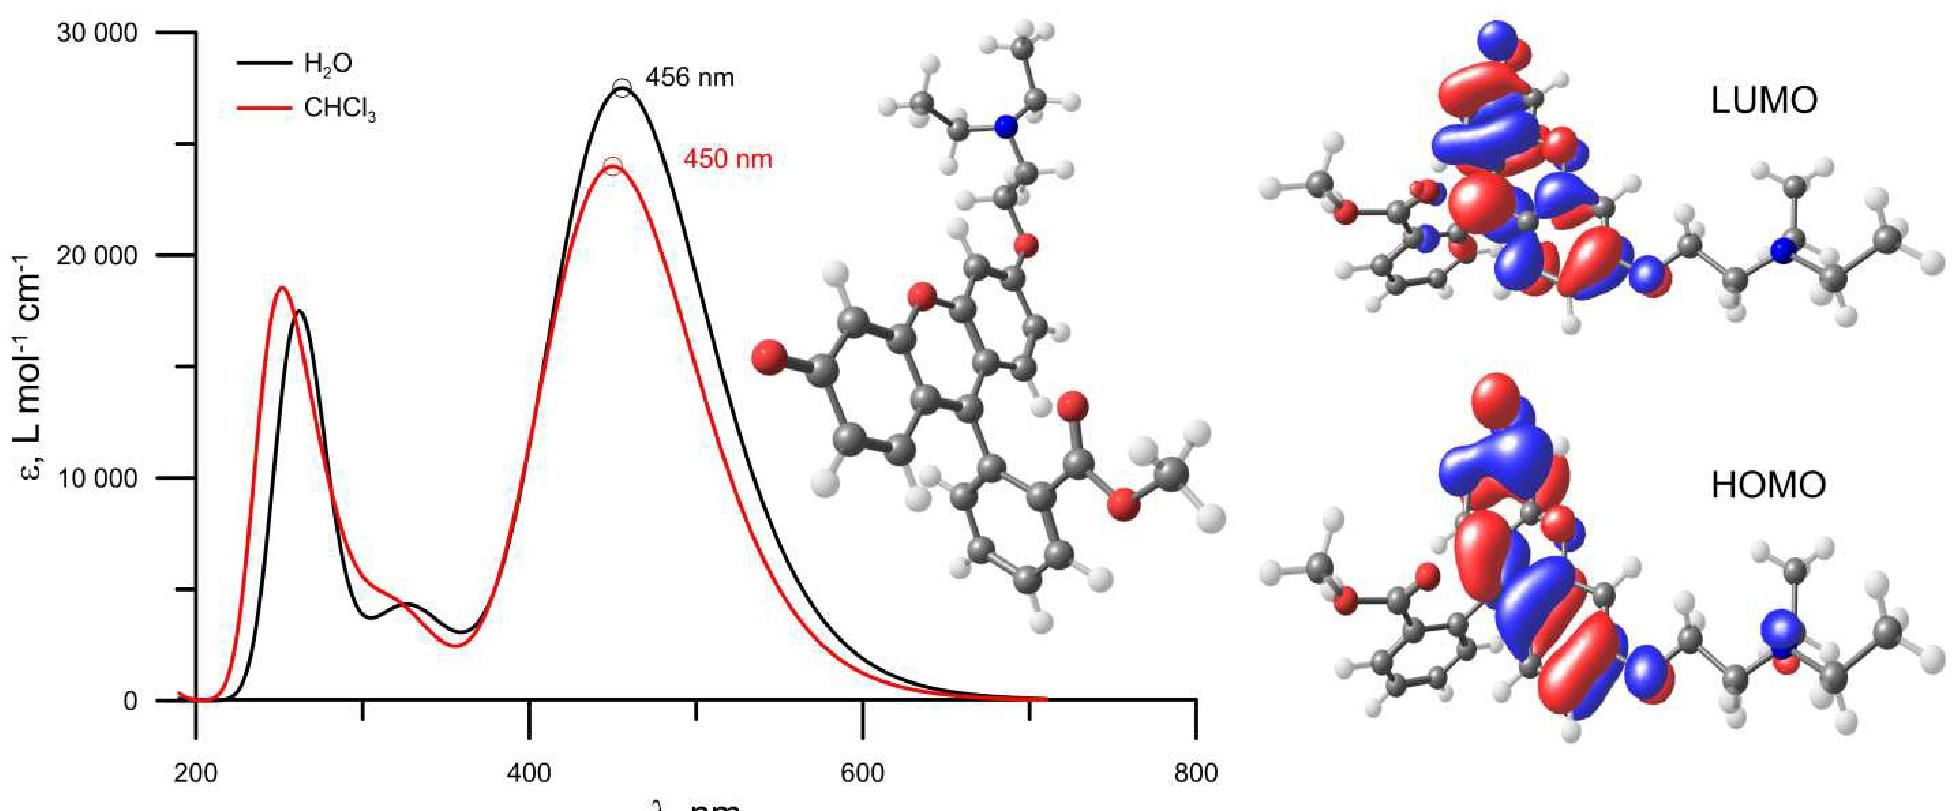
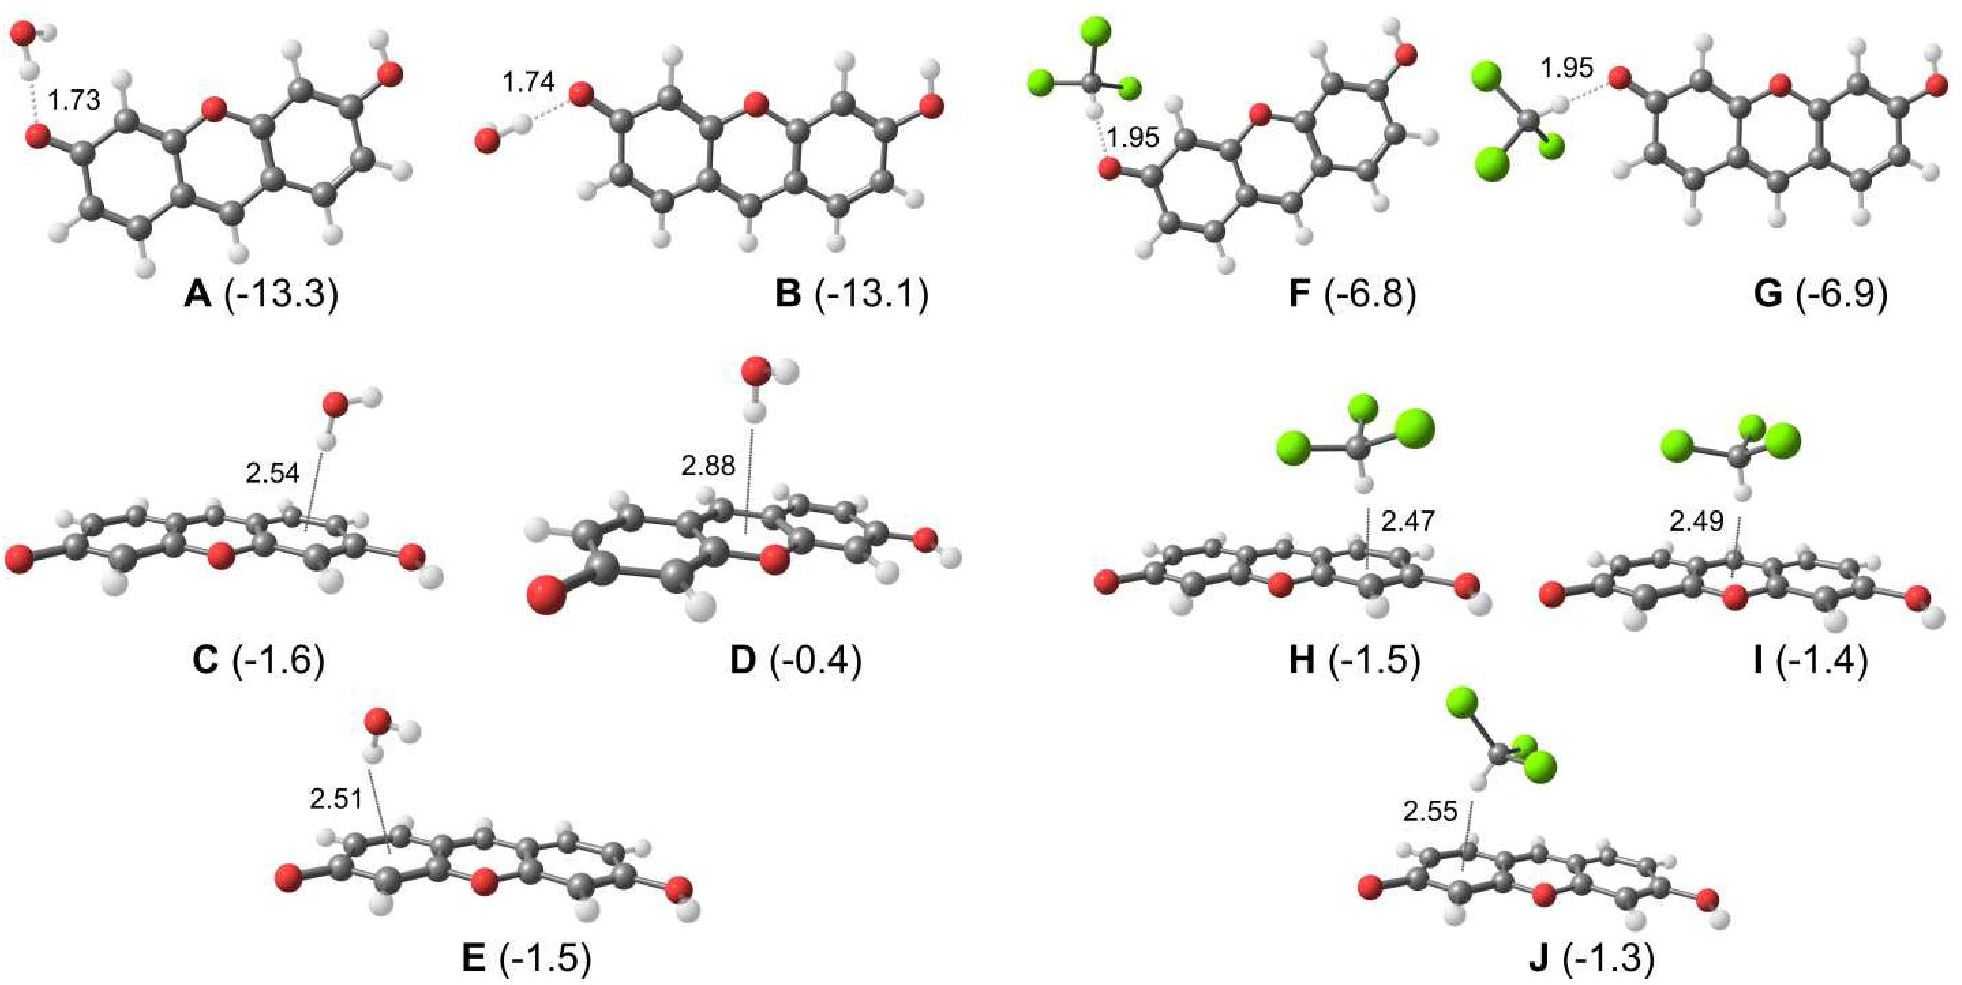
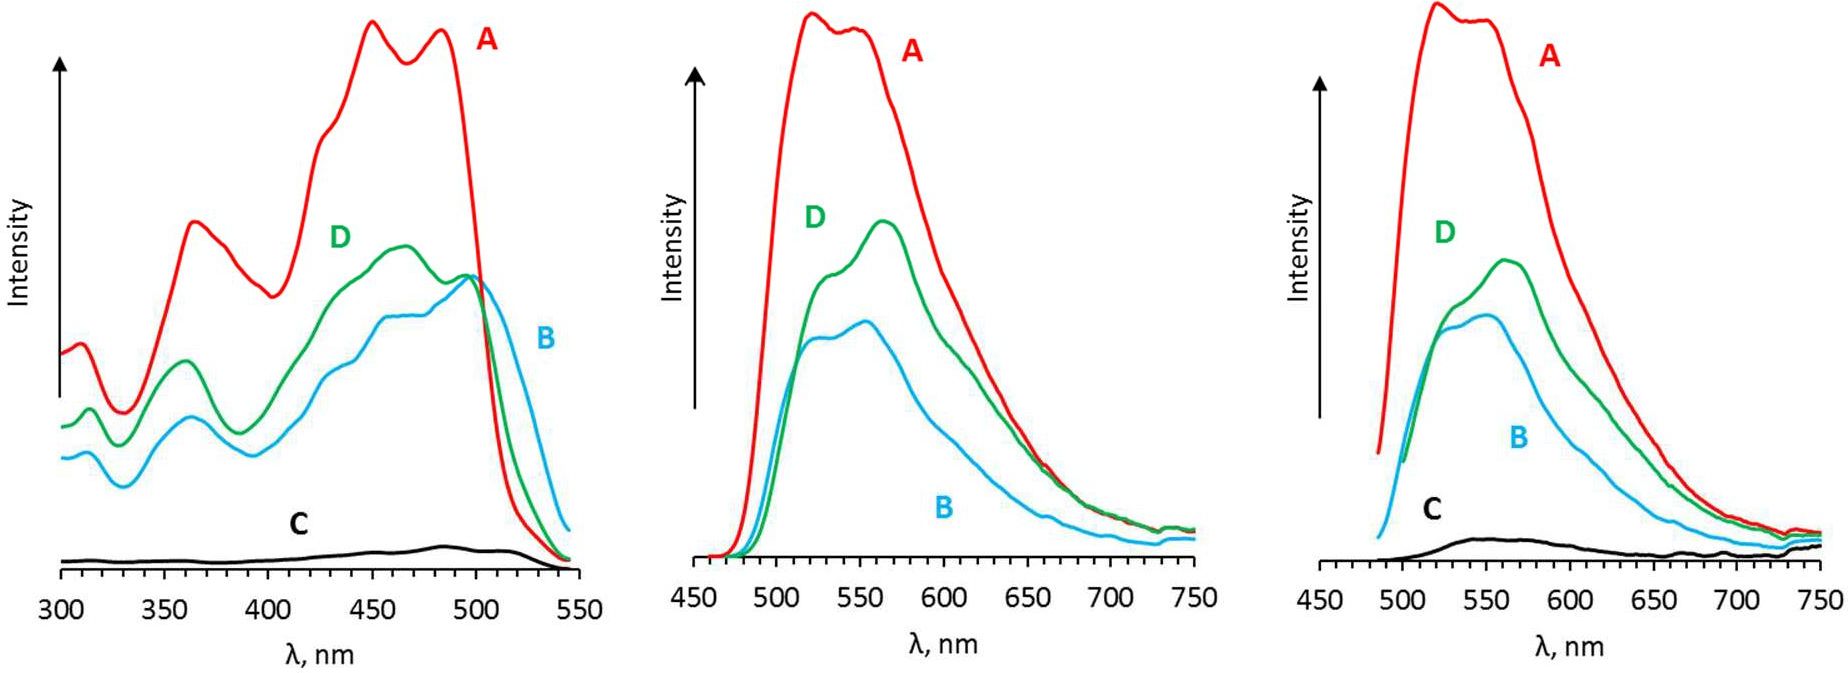
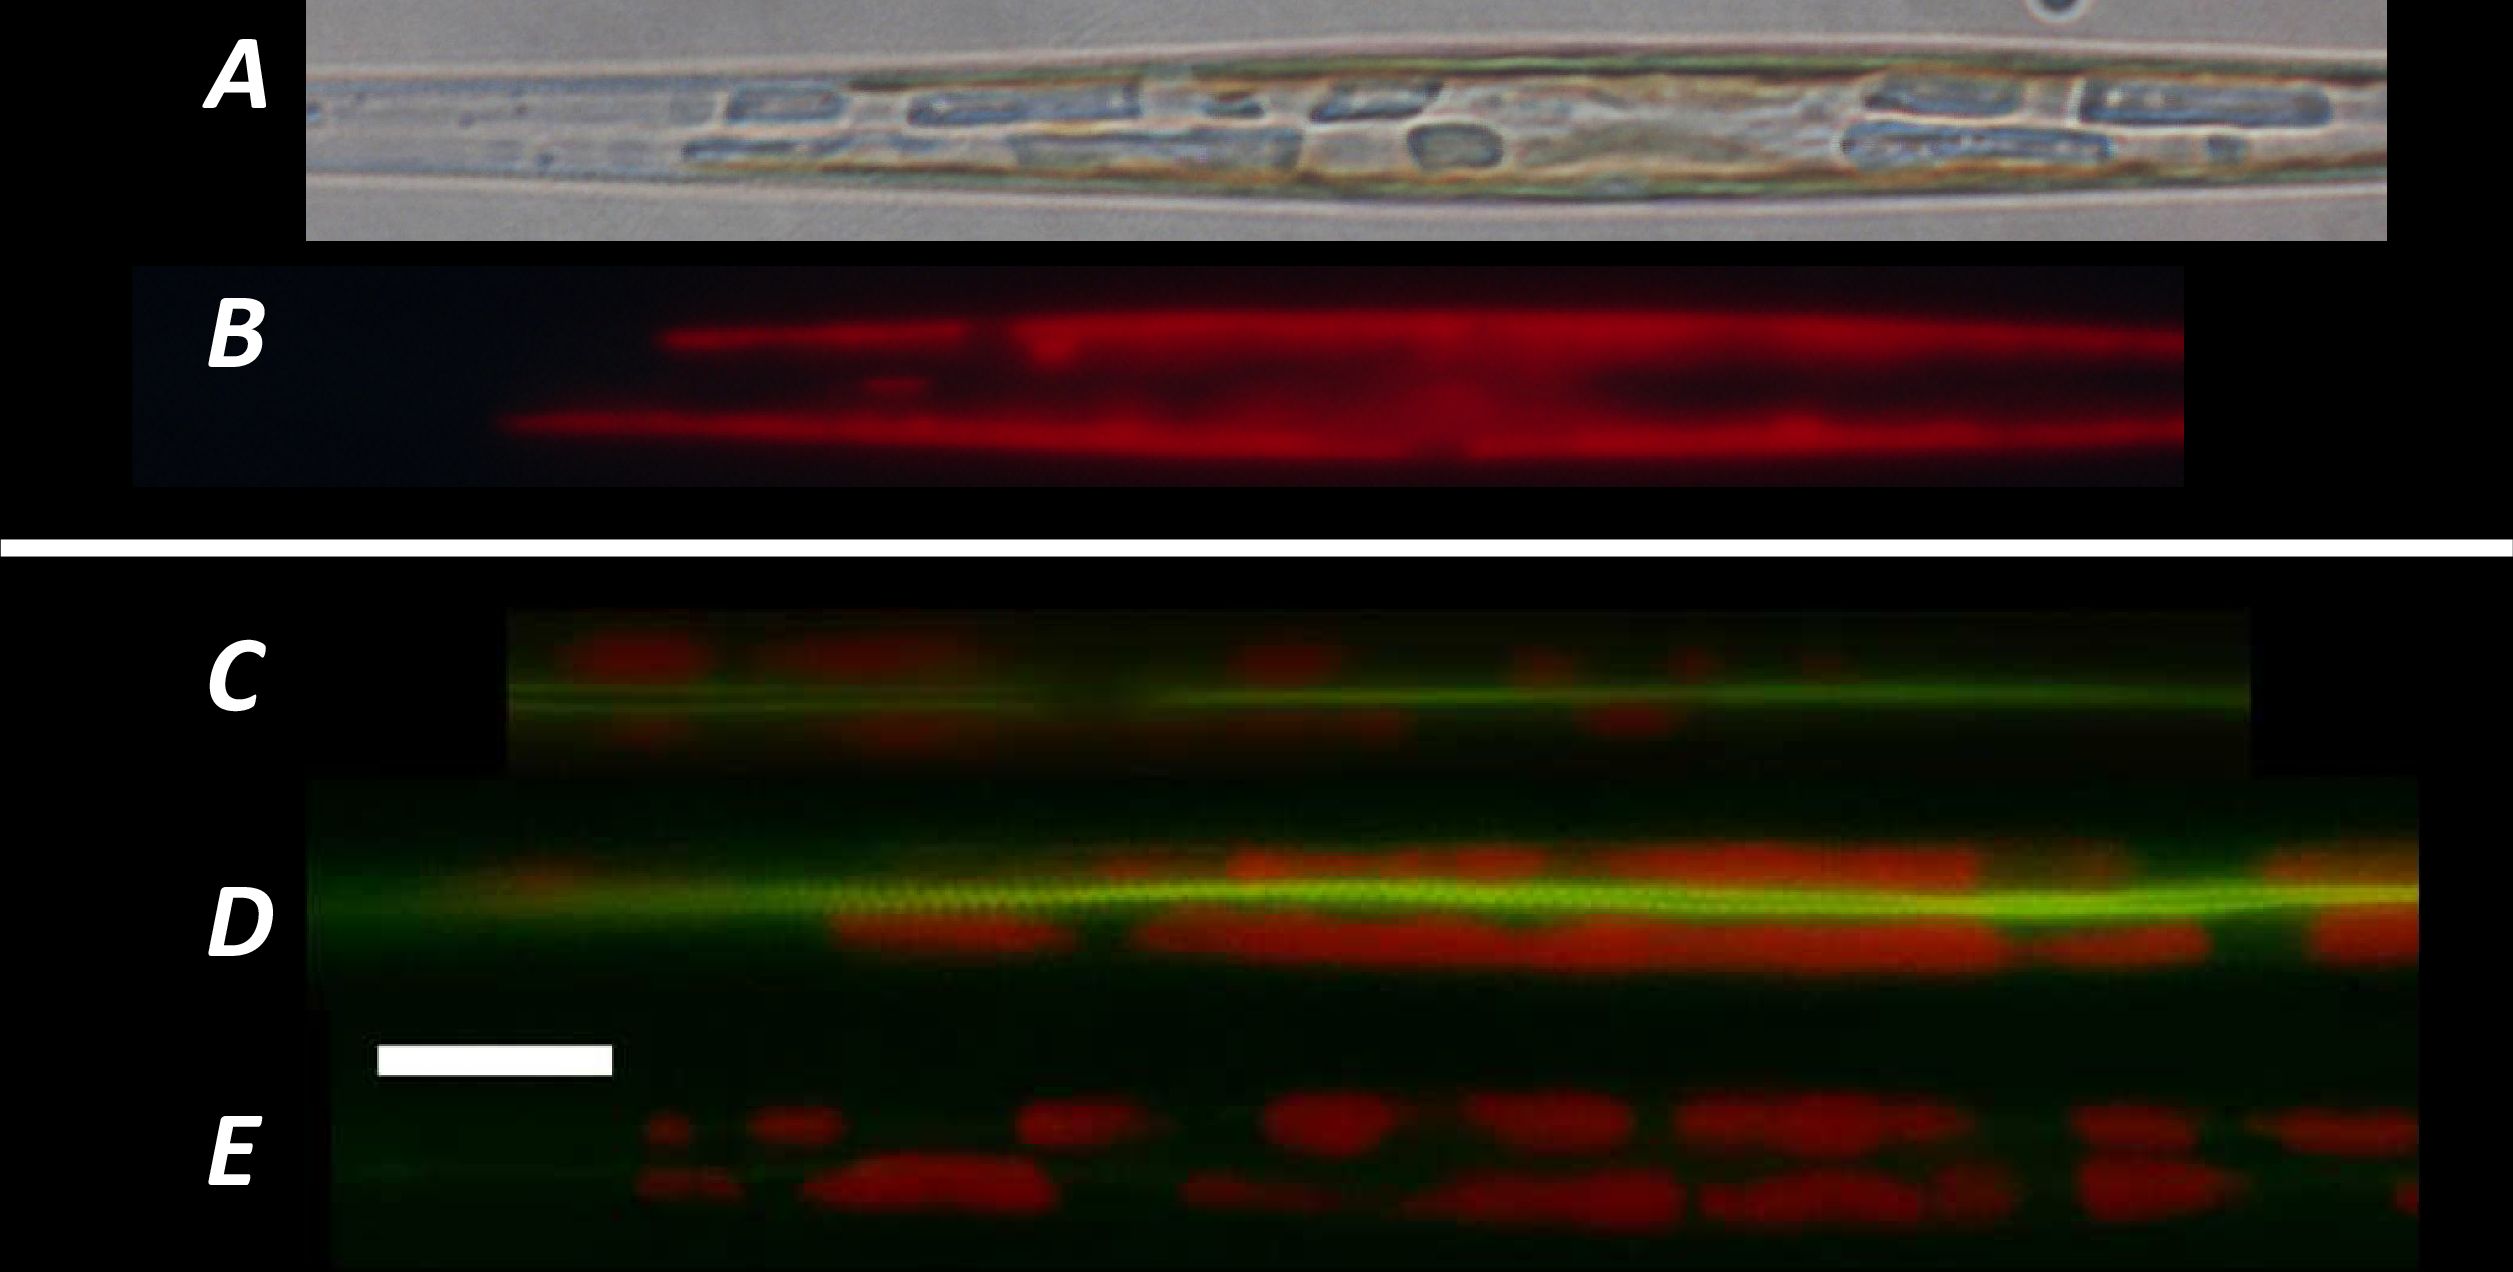
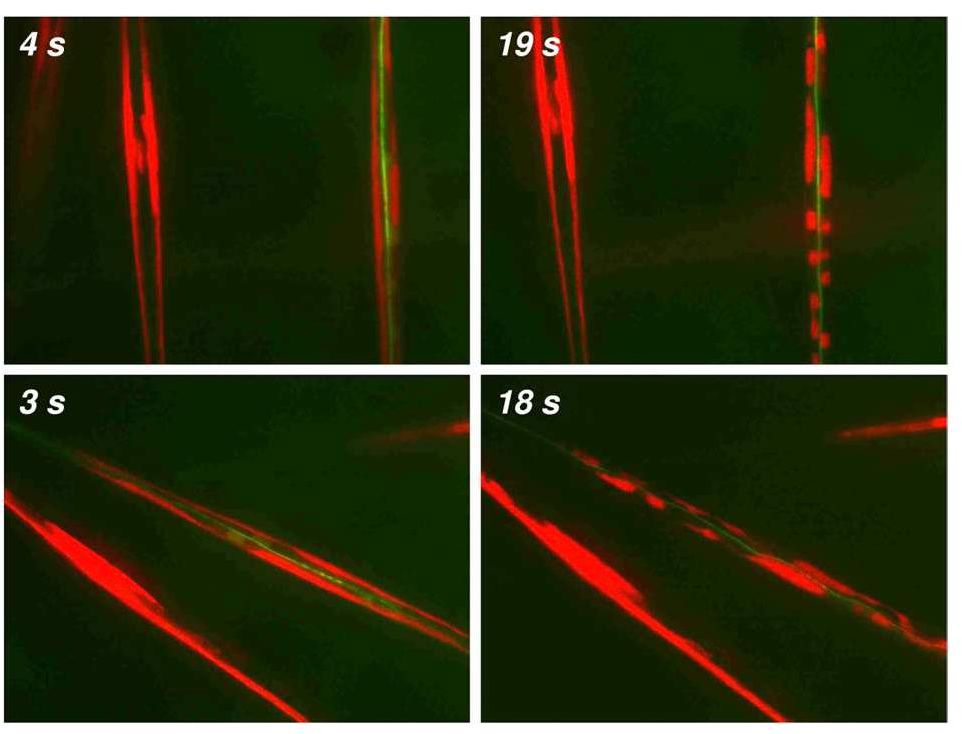
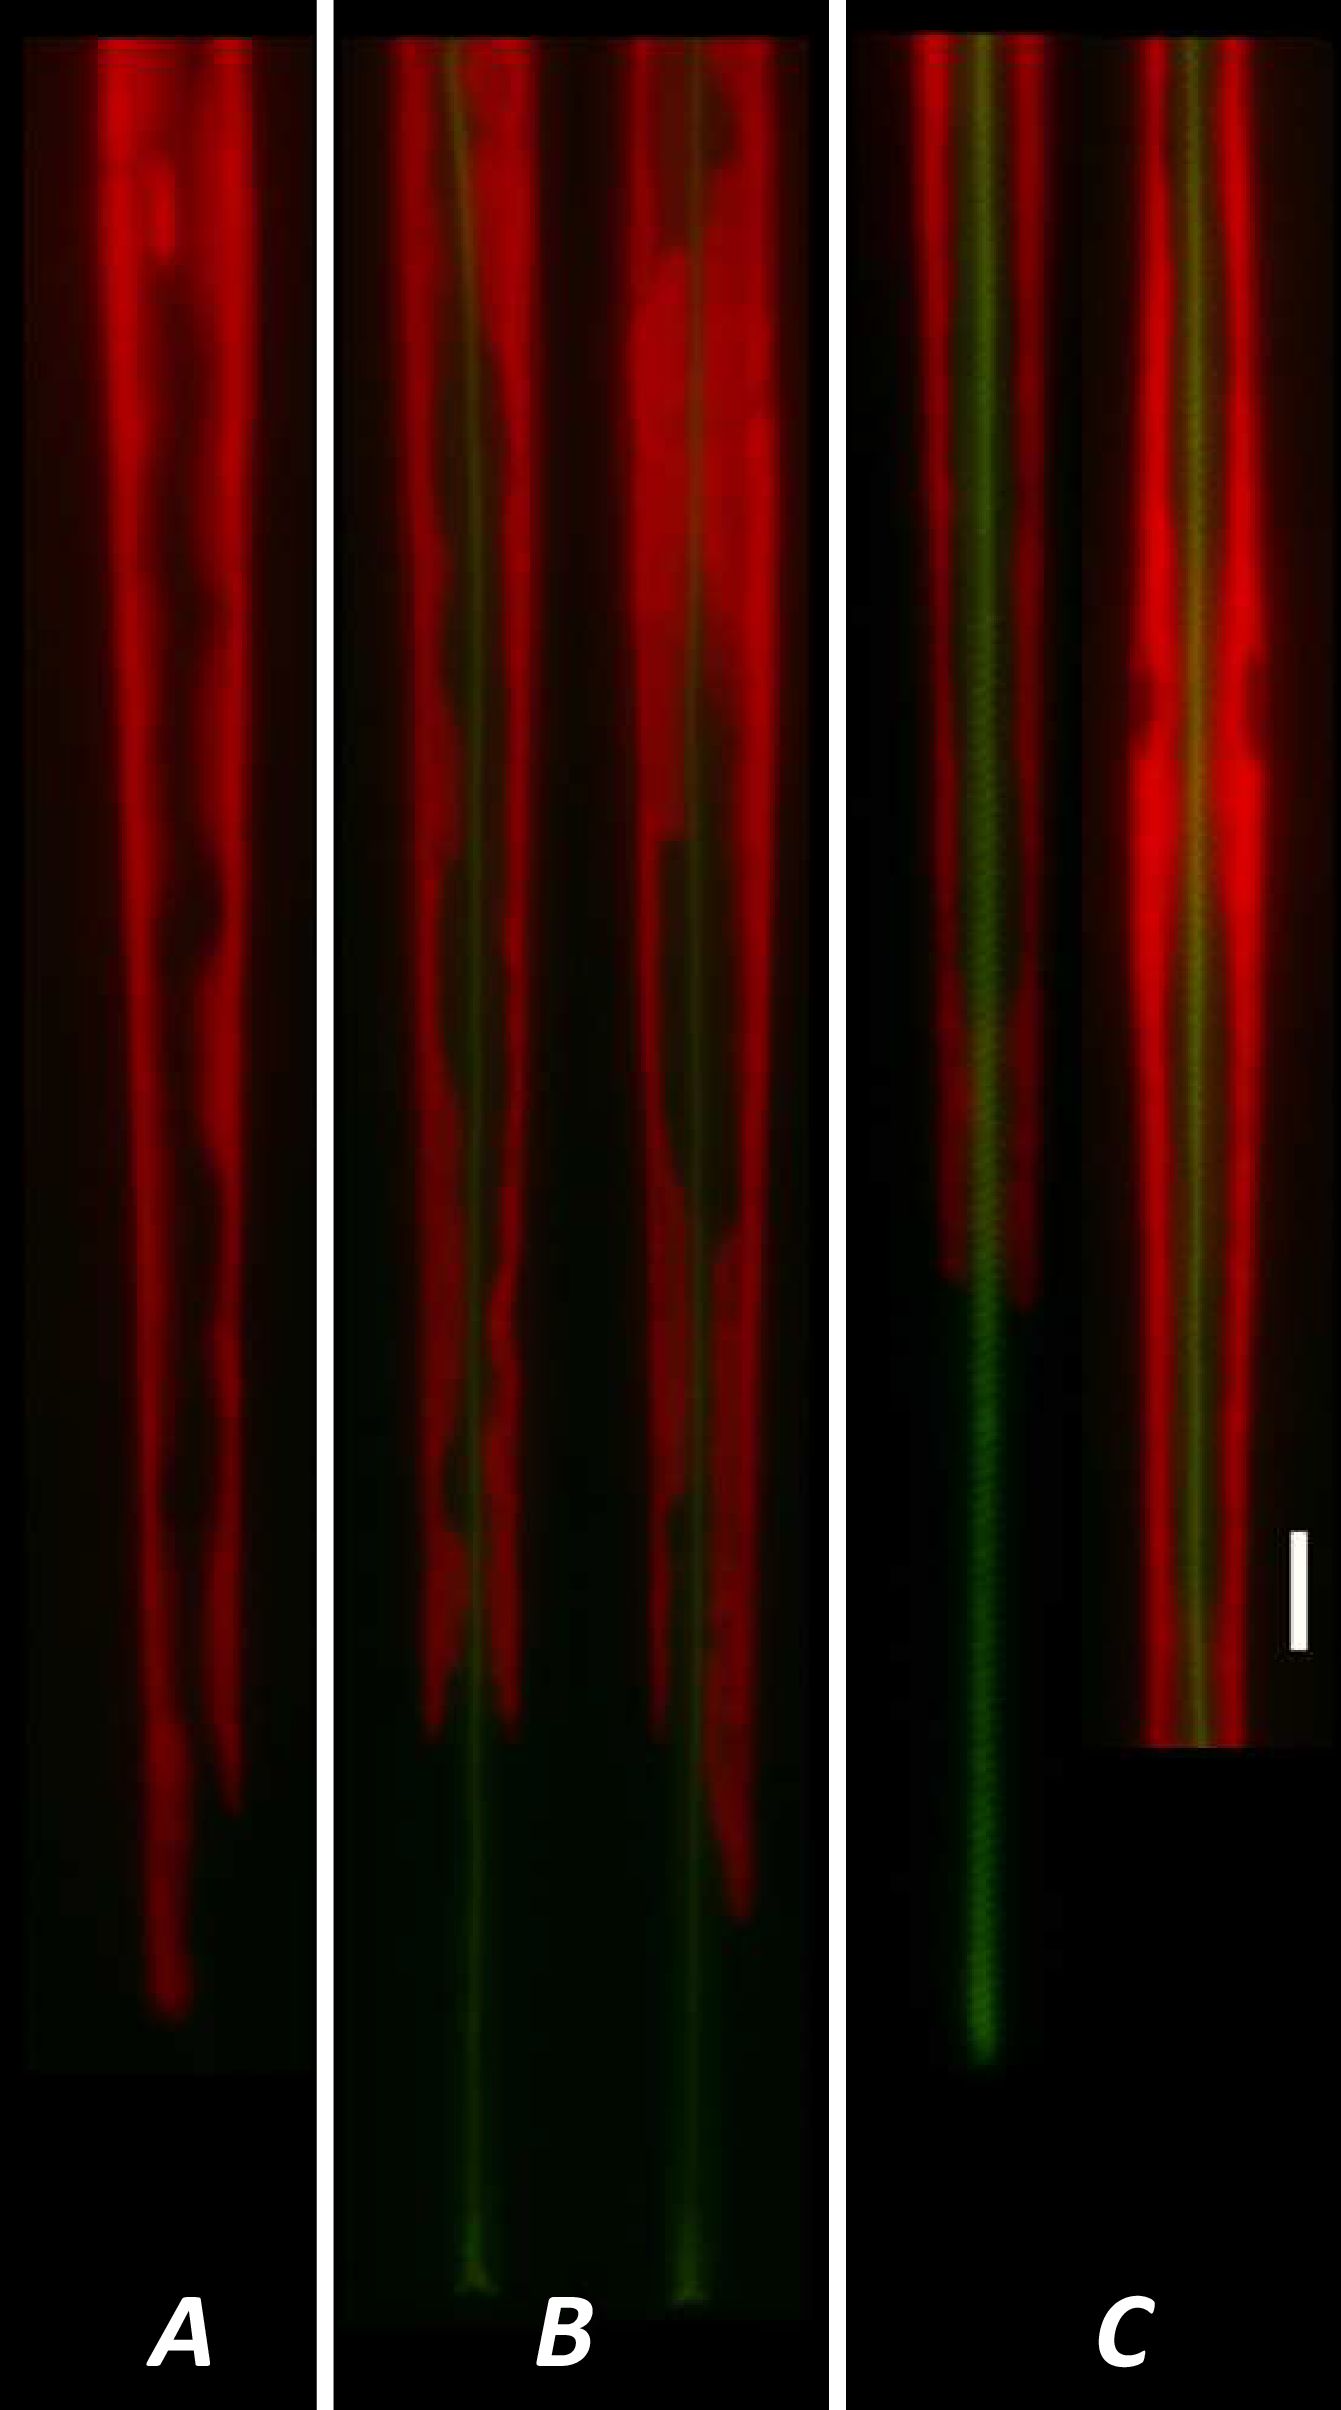
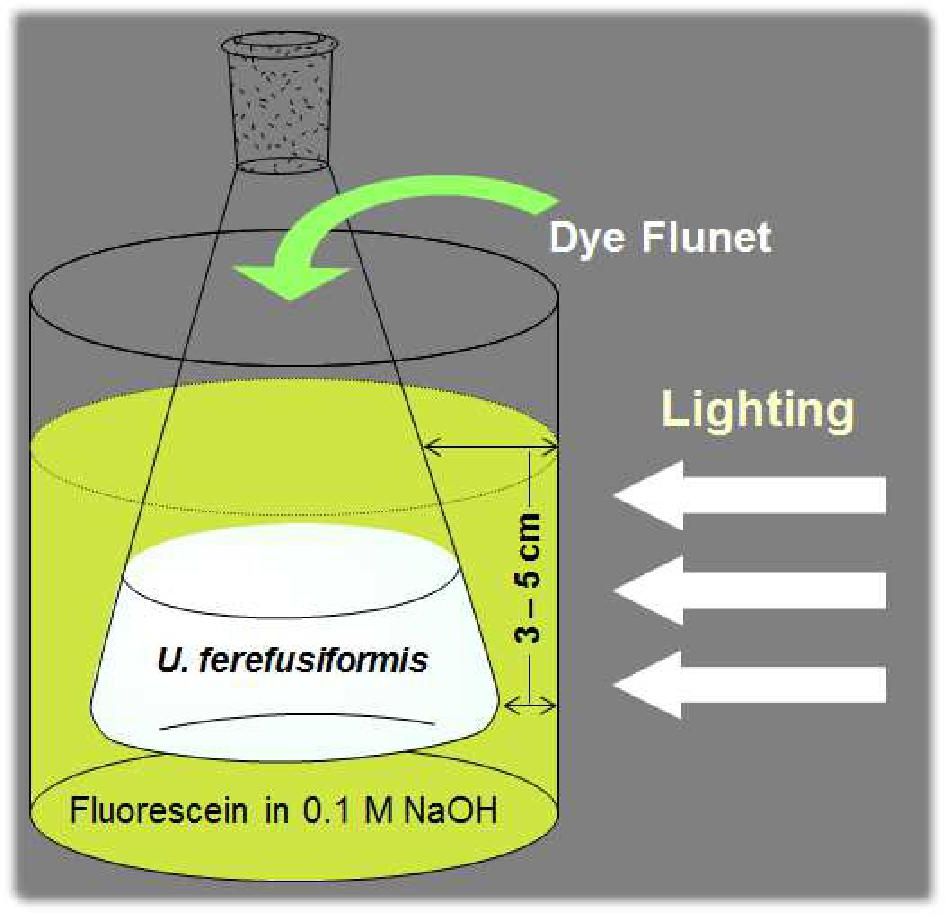
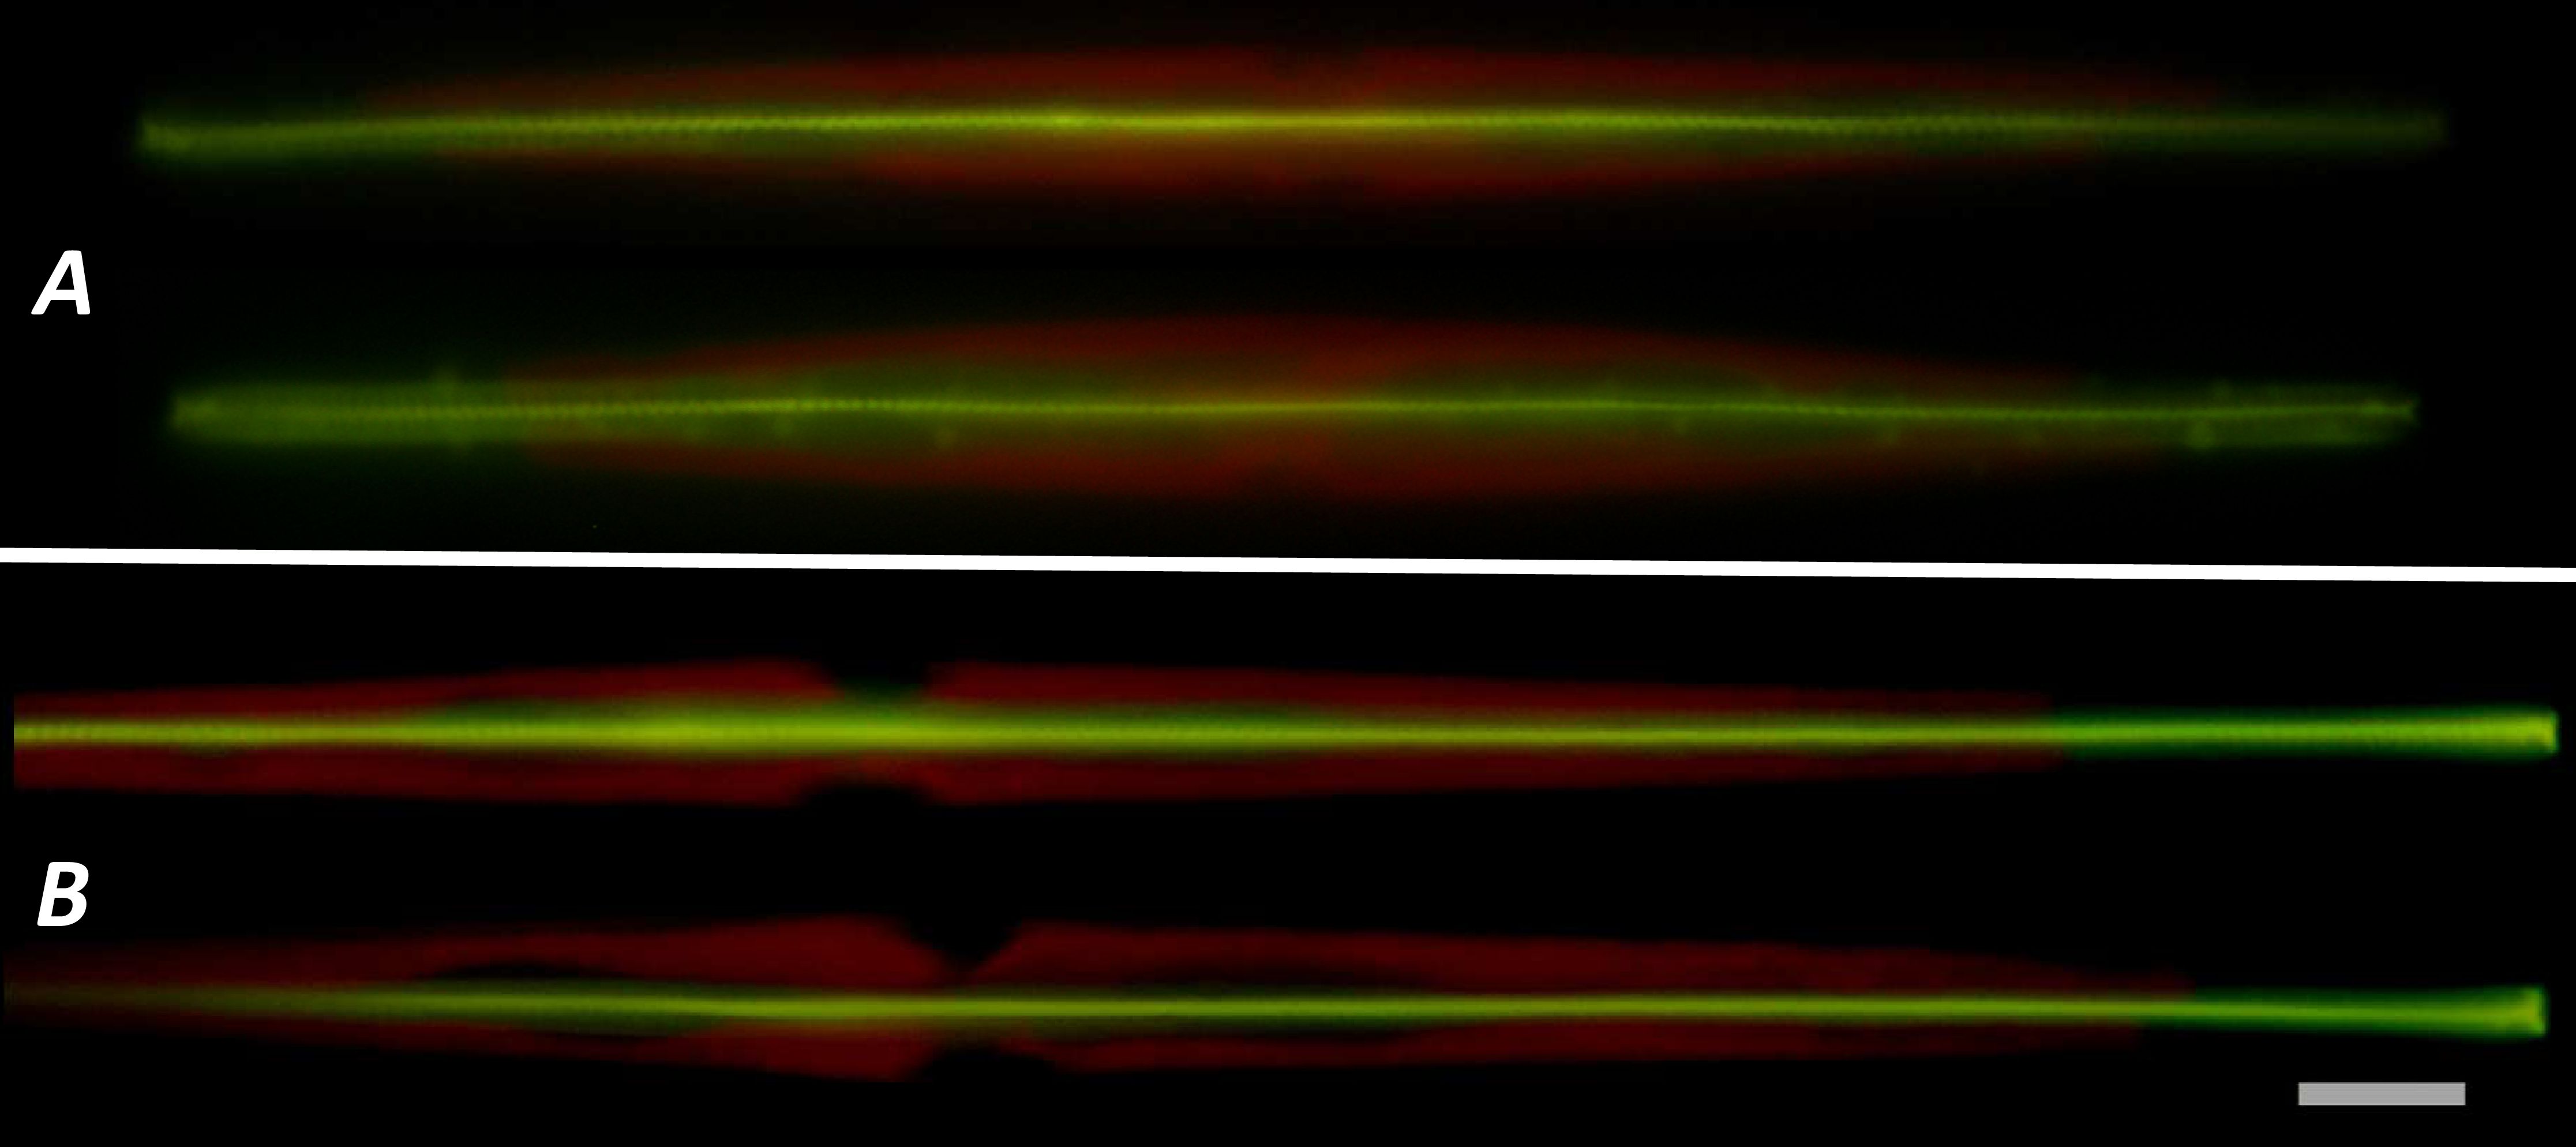
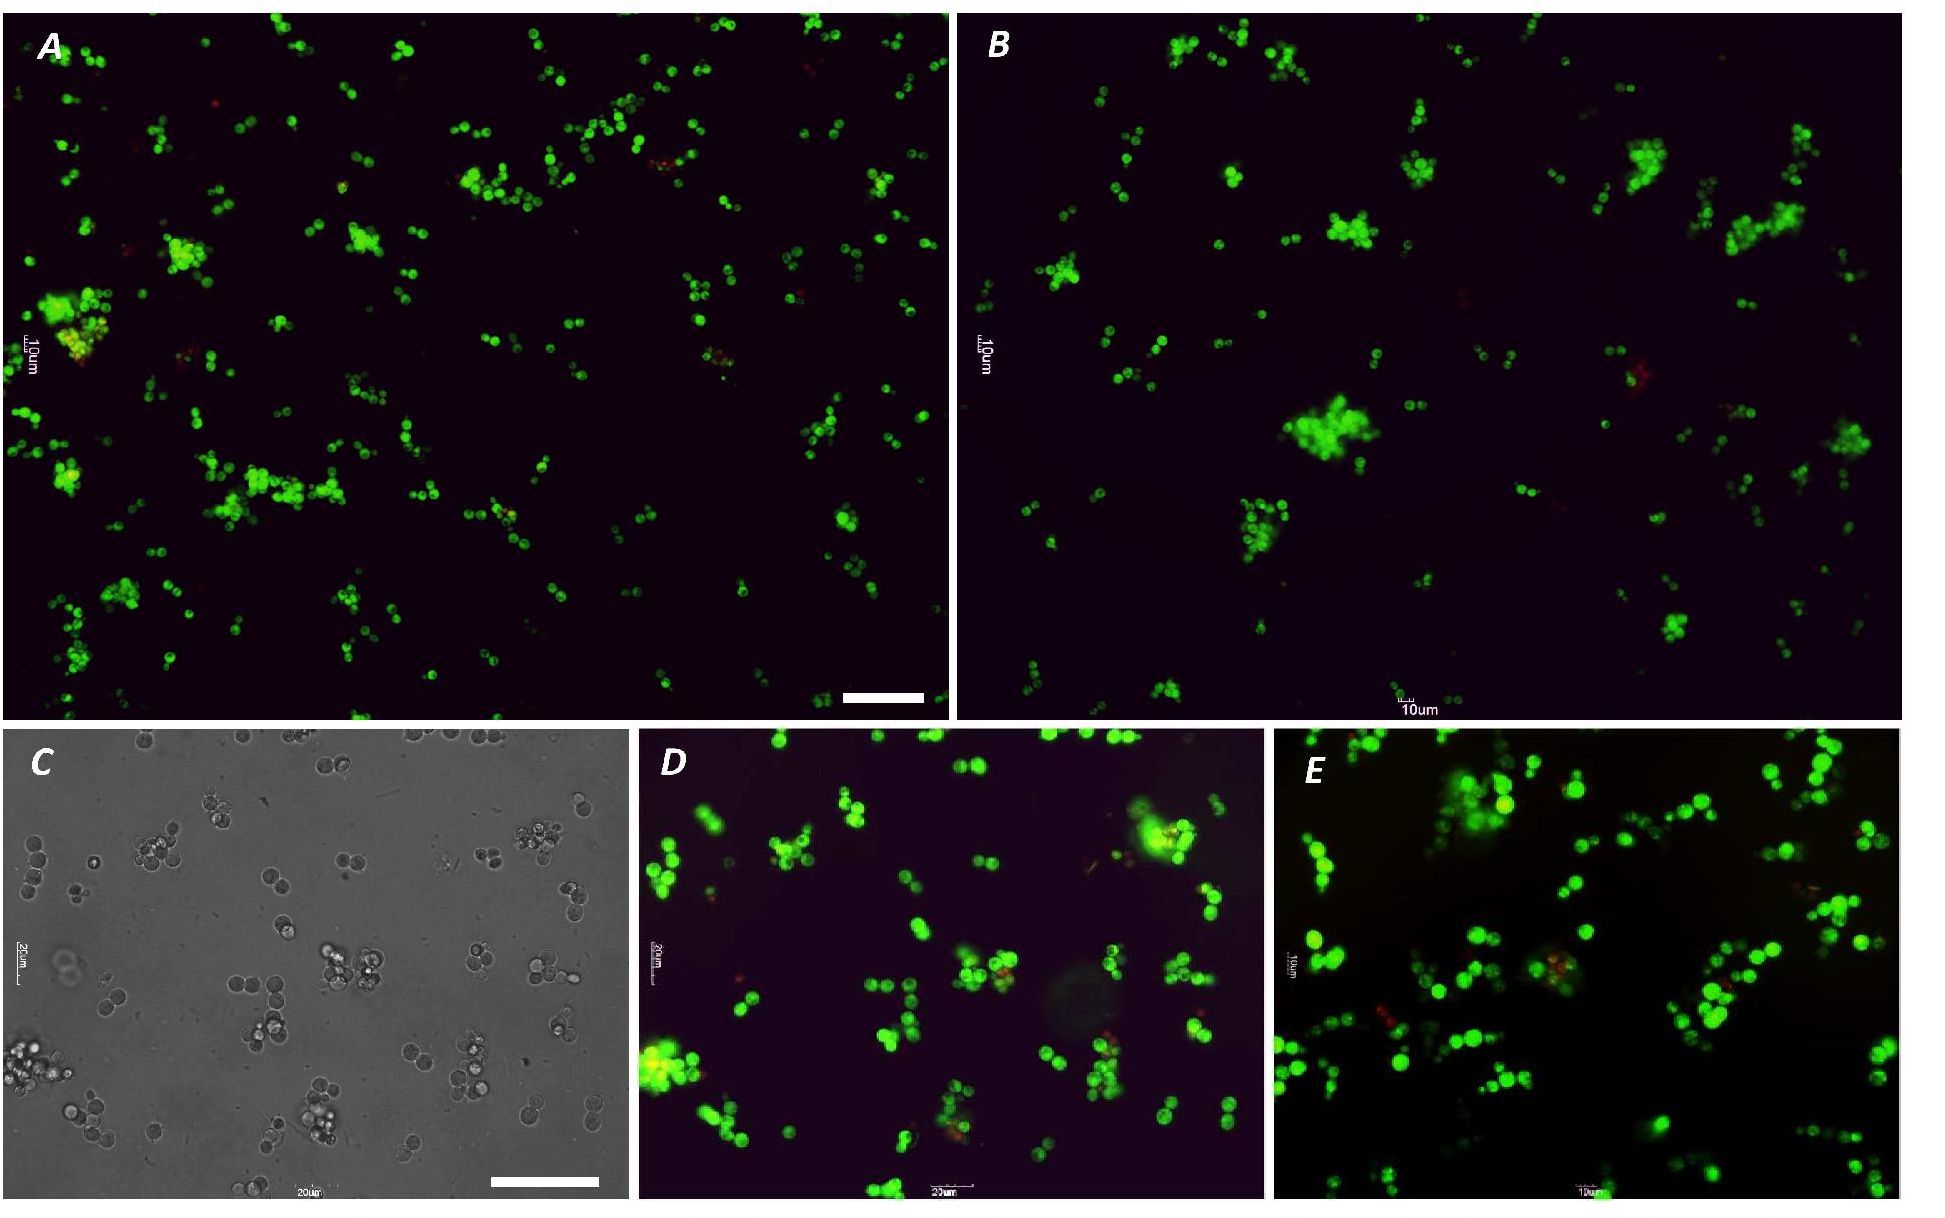
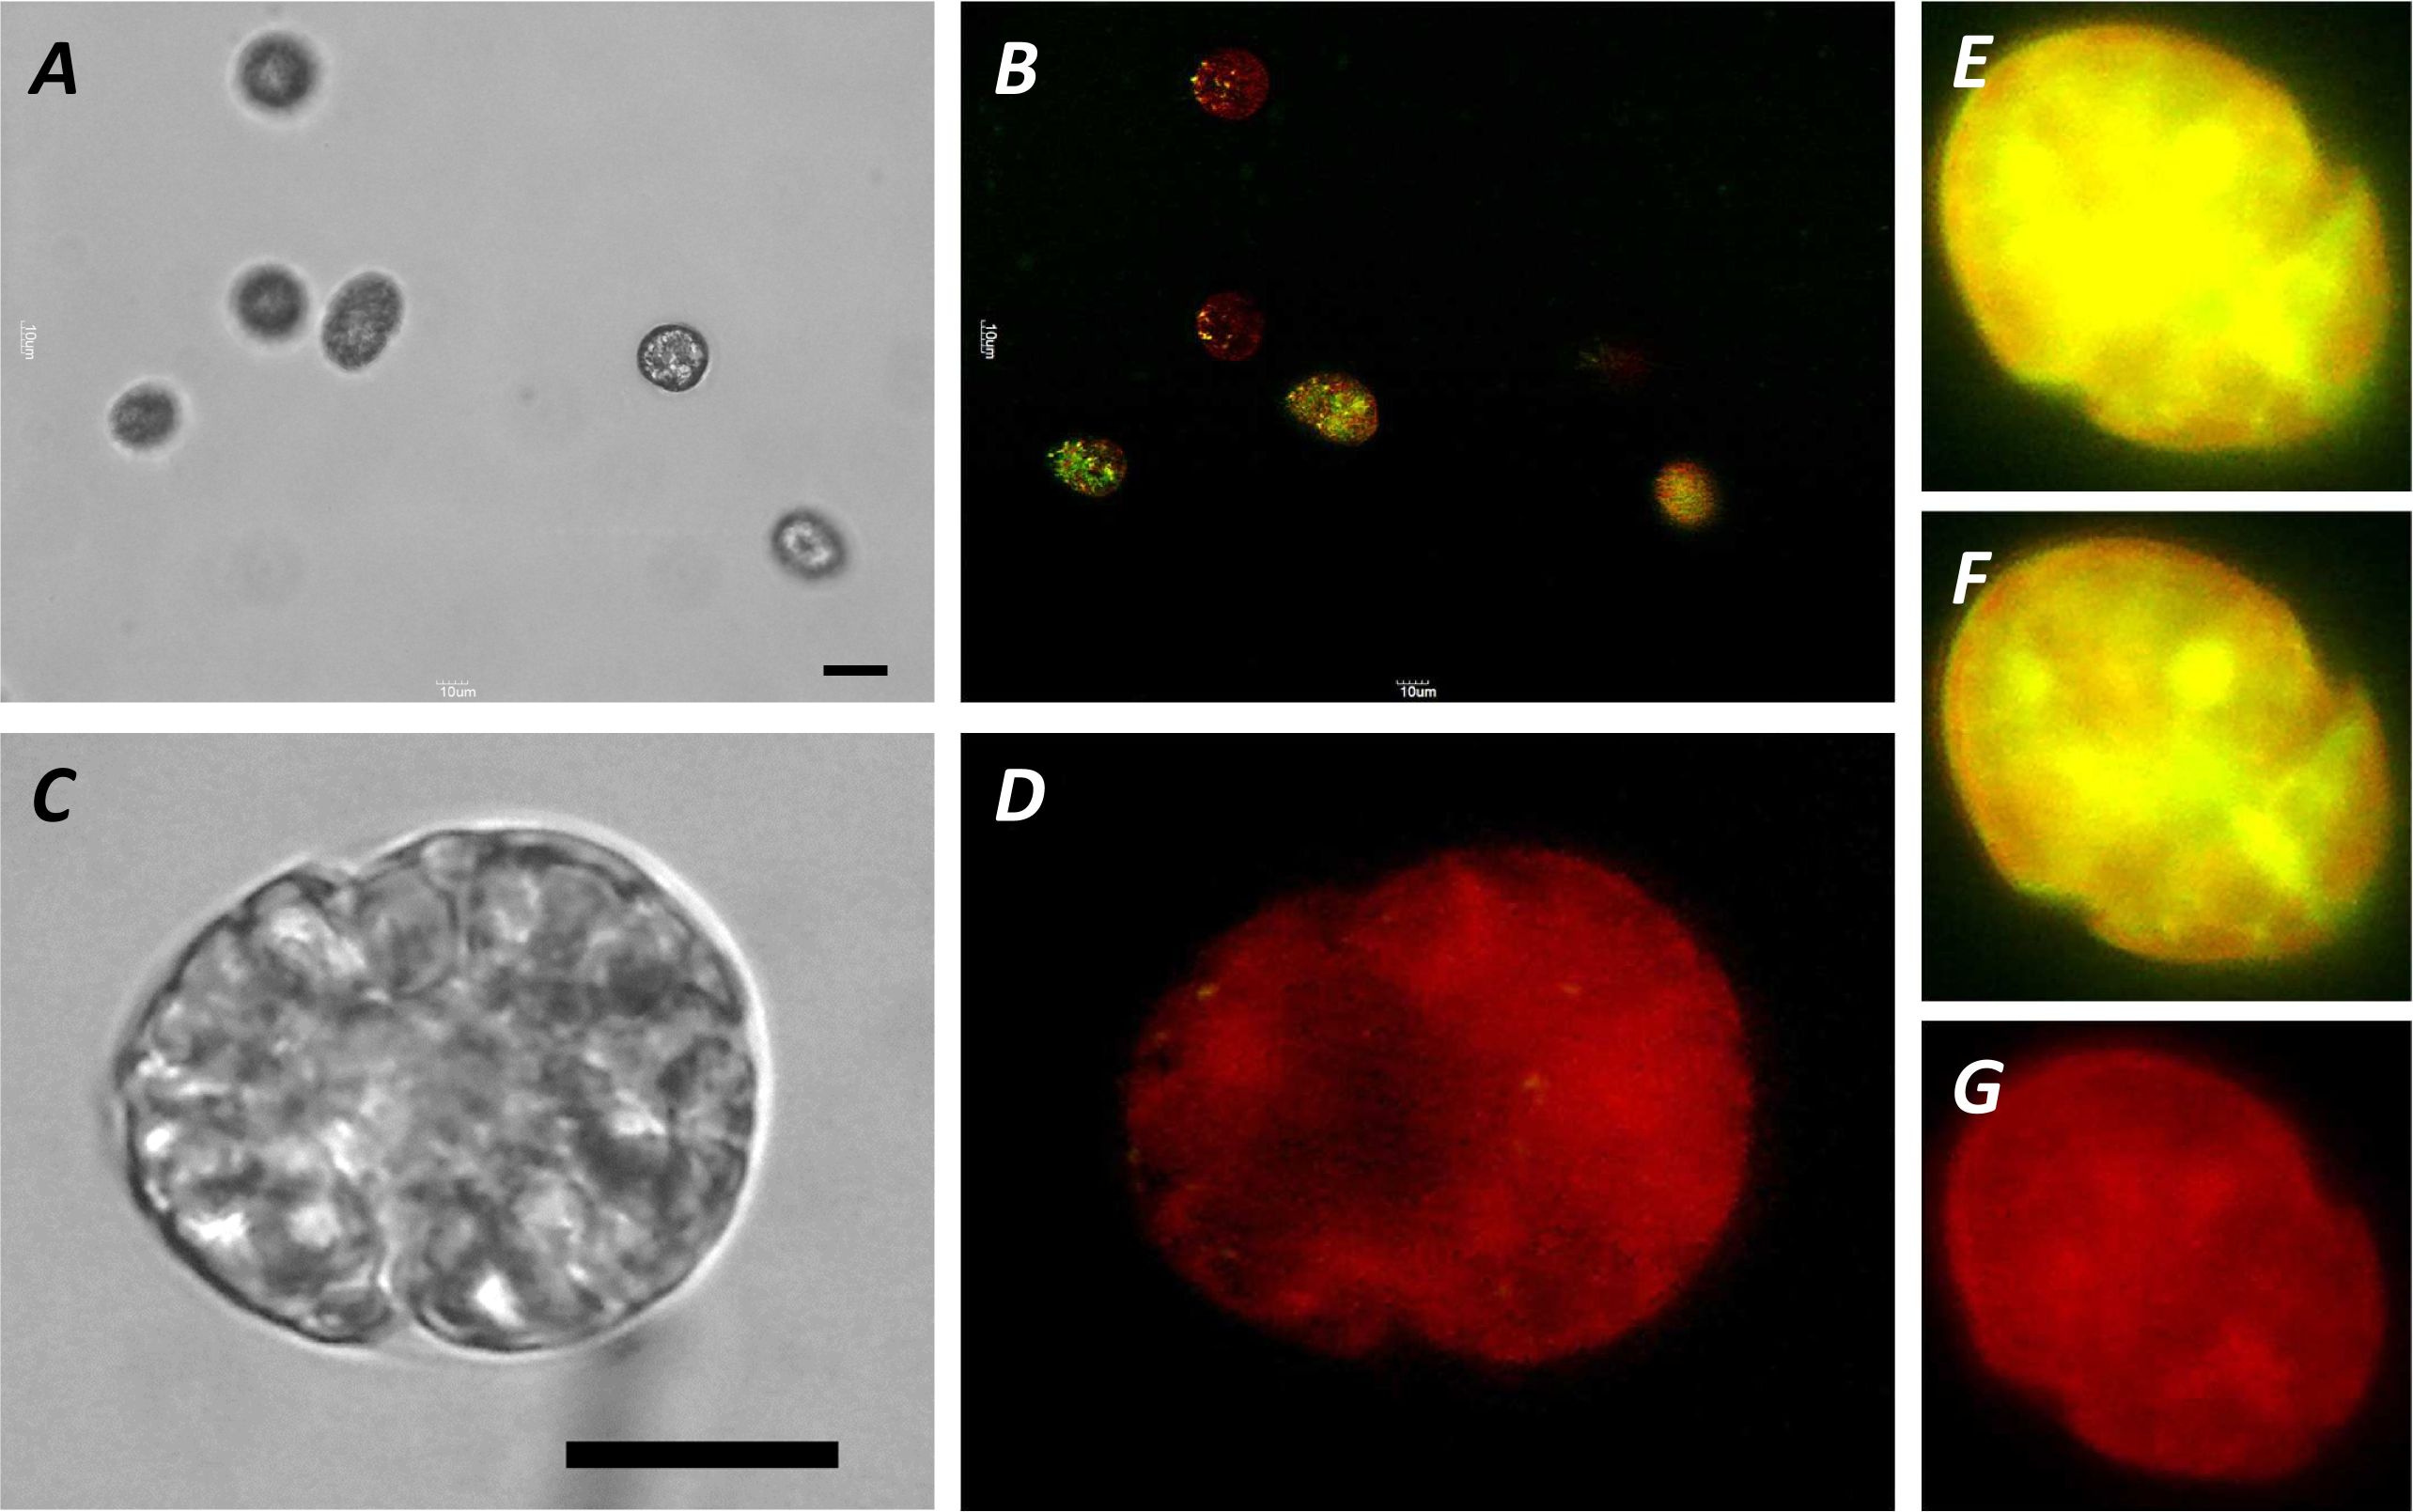
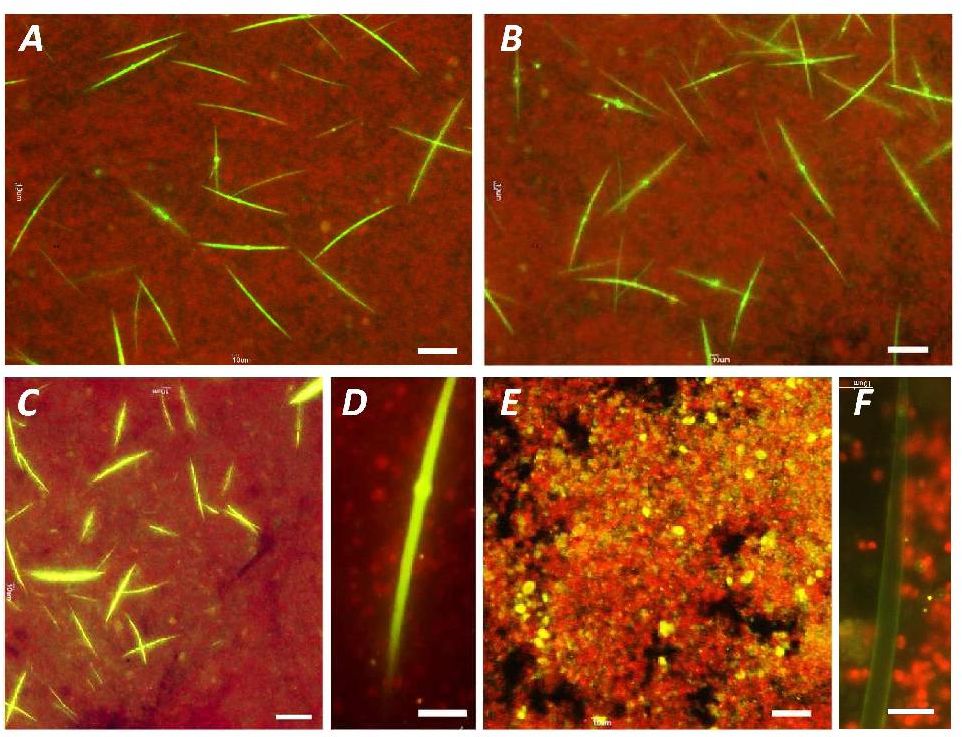
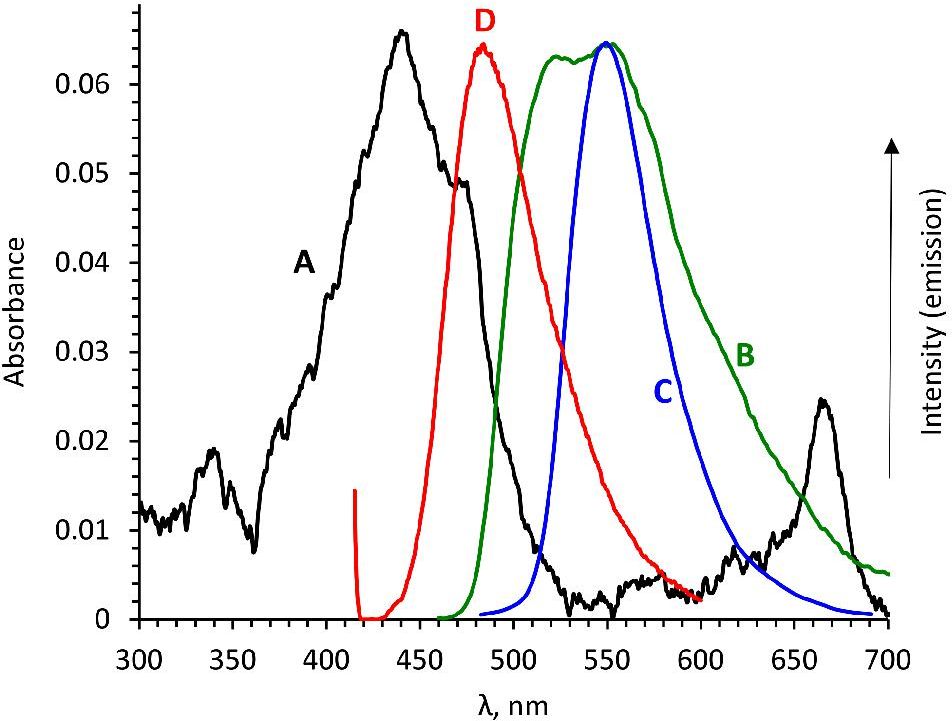
A method for the synthesis of a new amine-containing dye based on fluorescein (Flunet) was developed. The new dye exhibits pH-independent fluorescence in aqueous media and is able to penetrate living cells. Flunet can accumulate in the siliceous valve of diatom algae and cause cell death at a concentration of 0.5 μM, accompanied by chloroplast destruction. Flunet is nontoxic to yeasts and photosynthesizing dinoflagellates, but suppresses the growth of sponge primmorphs. Turning off the fluorescence of Flunet using a fluorescein shield protects diatom algae from death. Flunet, unlike other biosilica vital dyes, has emission in the red region (650-700 nm), which corresponds to the absorption band of chlorophyll. We suppose that once a significant amount of Flunet enters the siliceous valve of a diatom alga, it begins to convert blue light into green and red light, leading to the destruction of chloroplasts located very close (at the micrometer level) to the valve. Siliceous sponges can be suppressed in a similar way: light emitted by growing spicules destroys photosynthesizing sponge symbionts. Our findings open up a new way to influence silica-containing organisms by introducing different fluorescent dyes into the silica structures. This effect can be both positive (increased photosynthesis due to light tuning) and negative, leading to phototoxicity. Considering the main role of diatoms in biofouling of ships and other surfaces, the use of silica-penetrating dyes is a promising environmentally friendly way of antifouling protection.


Scheme 1. Structural formulas of known biosilica trackers.


Scheme 2. Scheme for the synthesis of the fluorescent dye Flunet.


Fig. 1. Absorbance spectra of Flunet in: A - aqueous phosphate buffer solution, pH 6.86 (50 mM), B - EtOH, C - 1,4-dioxane, D – chloroform, E – n-hexane. Flunet concentration was 24.9 μM.


Fig. 2. Simulated absorbance spectrum of Flunet in water and chloroform at the STEOM-DLPNO-CCSD/Def2-TZVPP//PBE0-D4/Def2-TZVPP level of theory and isocontour map of frontier orbitals.


Fig. 3. Hydrogen-bonded complexes of model 6-hydroxy-3H-xanthen-3-on with water and chloroform. The Bader’s contact energy (Econt) in brackets, kcal mol-1.


Fig. 4. The excitation (left λem =520 nm), emission at 455 nm excitation (center, for B λex = 465 nm) and at 480 nm excitation (right, for B λex = 495 nm) spectra of Flunet in: A - aqueous phosphate buffer solution, pH 6.86 (50 mM), B - EtOH, C - 1,4-dioxane, D – CHCl3 (50 mM). Flunet concentration in solutions was 10 μM.


Fig. 5. Optical (A) and fluorescent images of the diatoms U. ferefusiformis before (A and B) and after (C-E) 24 h cultivation in the presence of 1 μM Flunet. Green fluorescence – siliceous valves stained with Flunet and red fluorescence – chloroplasts. Scale bar represents 10 μm.


Fig. 6. Fluorescence images of diatom cells 20 min after addition of silicon and Flunet to synchronized culture. Flunet concentration was 1 μM. Cells were stored in the dark prior to observation; figures show observation time under 450 nm light. Green fluorescence – siliceous valves stained with Flunet and red fluorescence – chloroplasts.


Fig. 7. Fluorescent images of the diatoms U. ferefusiformis after 24 h cultivation in the presence of 0.001 (A), 0.01 (B) and 0.1 (Ρ) μM Flunet. Green fluorescence – siliceous valves stained with Flunet and red fluorescence – chloroplasts. Scale bars represent 5 μm.


Fig. 8. Scheme for culturing diatoms under a fluorescein shield (12 μM solution in 0.1 M NaOH).


Fig. 9. Fluorescent images of the diatoms U. ferefusiformis after 24 h cultivation in the presence of 1 μM NBD-N2 (A) and Flunet (B). Green fluorescence – siliceous valves stained with Flunet and red fluorescence – chloroplasts. Scale bars represent 5 μm.


Fig. 10. Images of S. cerevisiae cells (A, C, and D) and yeast cells with Flunet addition (B and E) after incubation for 24 h. Flunet concentration was 2.5 (B) and 5 (E) μM. The illumination was similar to the diatom algae experiments. Scale bars present 50 μm. Green fluorescence (A, B, D, and E) corresponds to live cells stained with fluorescein diacetate, and red fluorescence corresponds to dead cells stained with ethidium bromide.


Fig. 11. Microphotographs in visible light (A and C) and epifluorescence (450 nm excitation, B and D-G) of dinoflagellate cells G. corollarium cultivated in the presence of 1 μM Flunet during 48 h. Image D was obtained after complete photobleaching of the Flunet dye (about 10 s). Images E, F, and D were obtained from the video recording and correspond to moments 0.5, 1.5, and 7 s after the onset of illumination of the cell with 450 nm light. Red fluorescence from chloroplasts, yellow-green from Flunet. The scalebars correspond to 20 (A and B) and 10 (C and D) μm.


Fig. 12. Fluorescence images of L. baicalensis primmorphs cultivated in the presence of 0.5 μM Q-N2 dye [7] (A and B) and in the presence of 0.33 (C and D) and 0.5 (E and F) μM Flunet. Red fluorescence from symbionts, green from silica stained with Q-N2 or Flunet. The scalebars correspond to 50 (A-C and E) and 10 (D and F) μm.


Fig. 13. Absorption spectrum of methanol extract of U. Ferefusiformis (A) and emission spectra at pH 5.5: Flunet (B, excitation at 455 nm), NBD-N2 (C, excitation at 470 nm), and Q-N2 (excitation at 410 nm).