.
Oven
Amine1
Vadim V. Annenkov, Stanislav N. Zelinskiy, Viktor A. Pal'shin, Lyudmila I. Larina, Elena N. Danilovtseva Coumarin based fluorescent dye for monitoring of siliceous structures in living organisms Dyes and Pigments 2019, 160:336-343, DOI:10.1016/j.dyepig.2018.08.020
Fluorescence dyes capable to specific interactions with definite substances are applied in biology for visualization of organelles and tracking of single molecules. The dyes which bear basic moieties are capable to stain acidic vesicles, including lysosomes and silica deposition vesicles in diatom algae. A new coumarin based fluorescent dye Q-N2 which contains amine fragment was synthesized. The new dye shows blue fluorescence which spectrum in water solutions does not depend on pH value but a green fluorescence appears when the dye is aggregated with siliceous surfaces or is entrapped into siliceous materials, e.g. valves of diatom algae. This effect allows to use Q-N2 dye for tracking silicification and biosilicification processes. Cultivation of diatom algae Ulnaria ferefusiformis (M.Kulikovskiy & H.Lange-Bertalot, 2016) in the presence of Q-N2 shows presence of condensed siliceous particles in the cell cytoplasm in several seconds after beginning of silicic acid consumption from the environment. This observation affords a basis to suppose formation of condensed siliceous structures (oligosilicates) during transportation of silicic acid through the cell membrane.
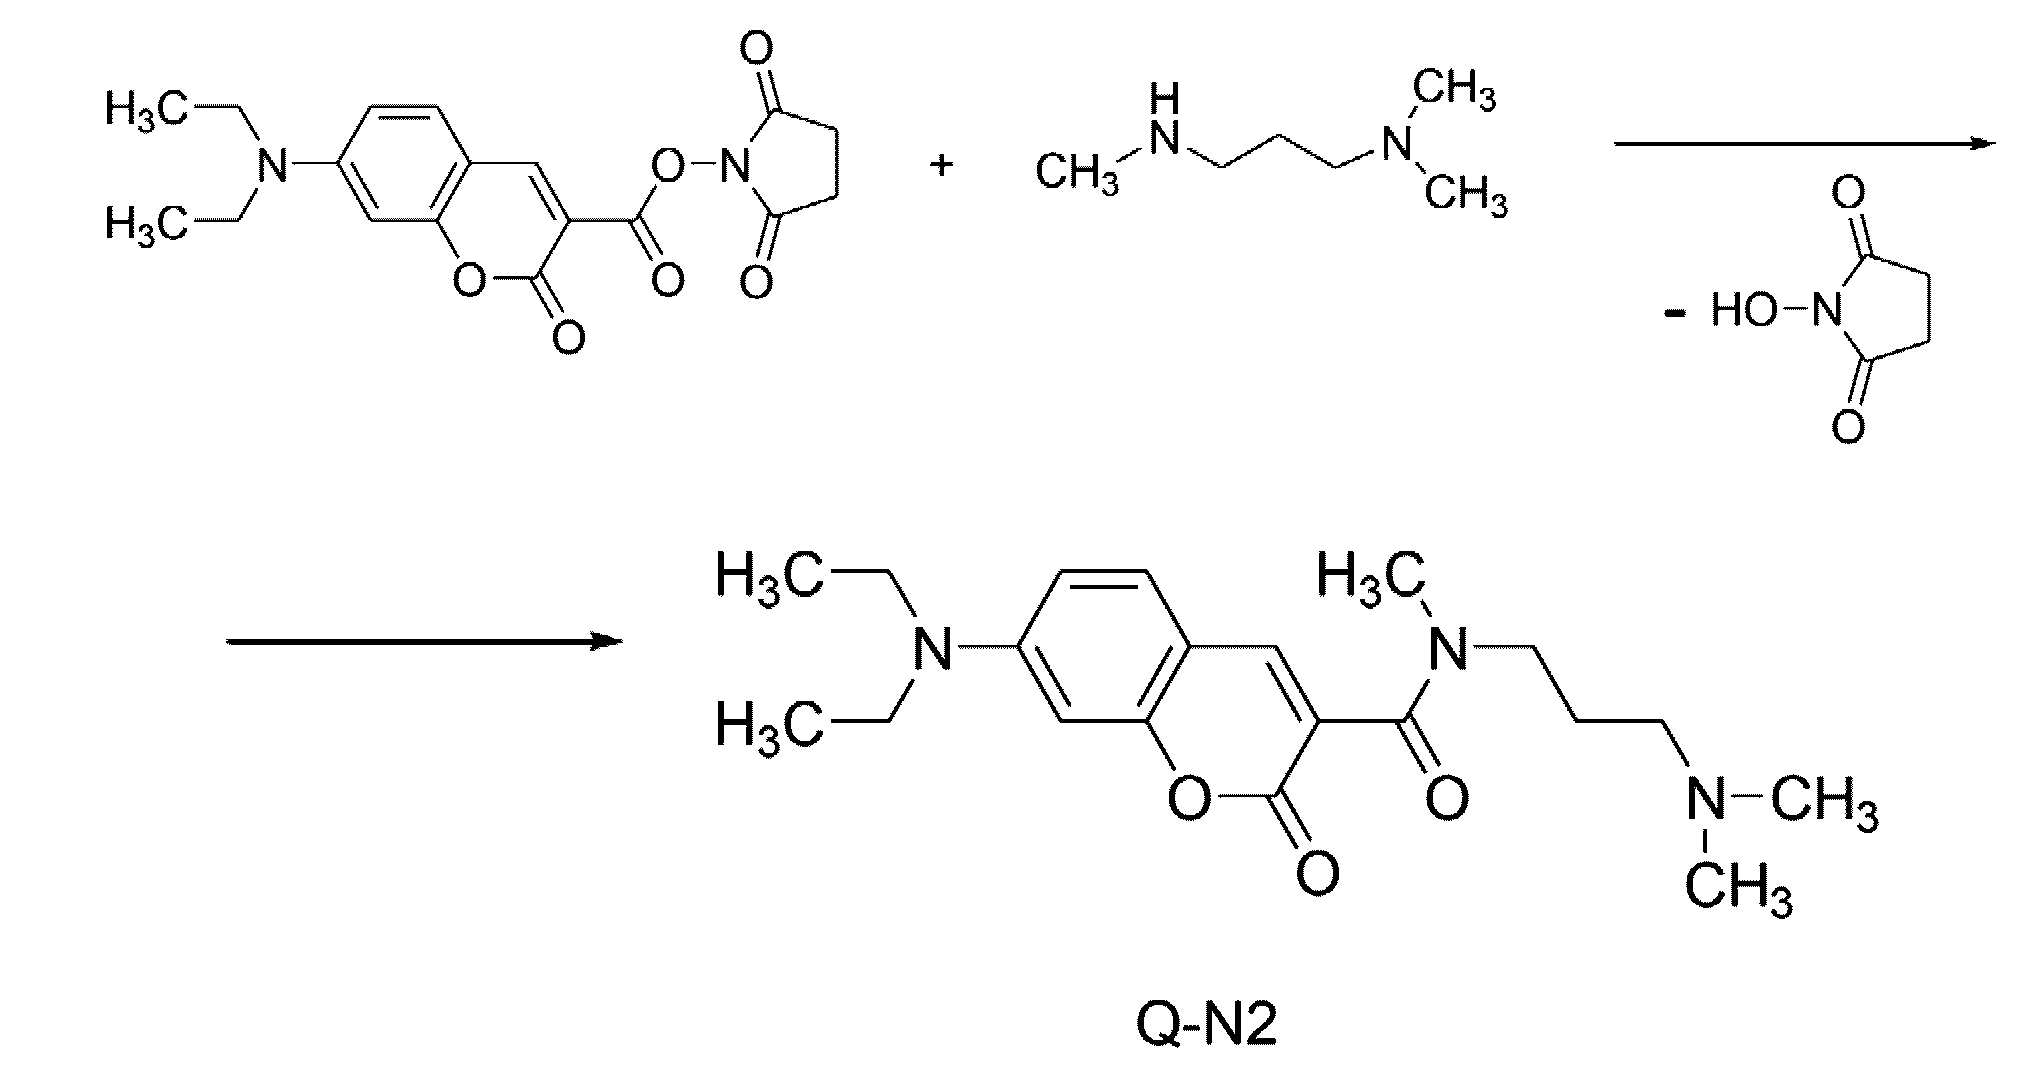 Q-N2 was synthesized by the reaction of succinimidyl ester of 7-(diethylamino)coumarin-3-carboxylic acid with N,N,N'-trimethyl-1,3-propanediamine in DMFA.
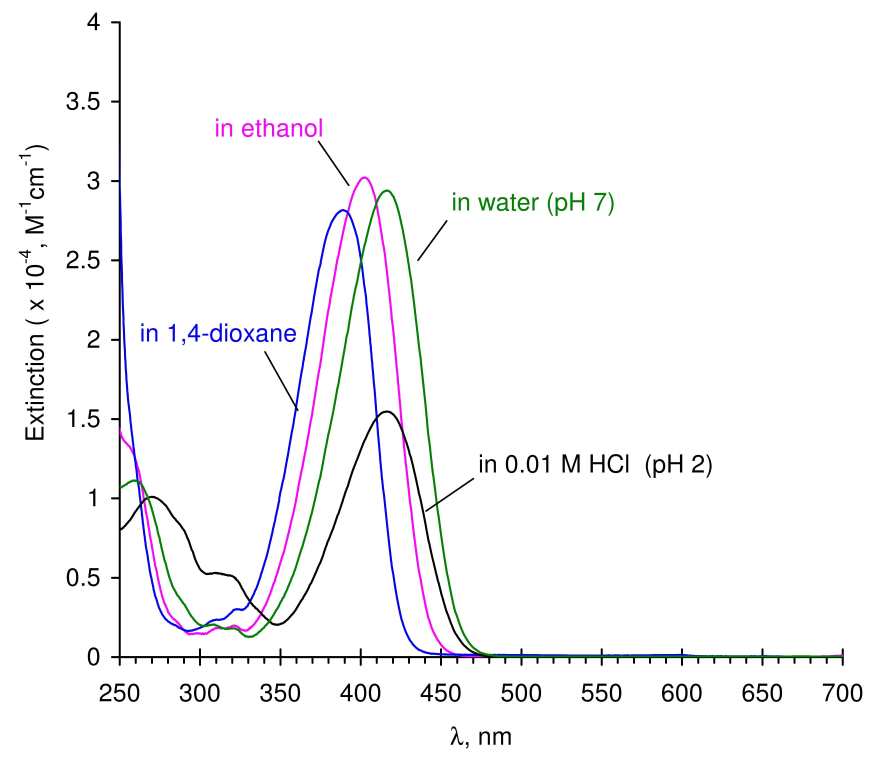
Fig. 1. The absorption spectra of Q-N2 dye. Concentration of Q-N2 in solutions is 25 μM.
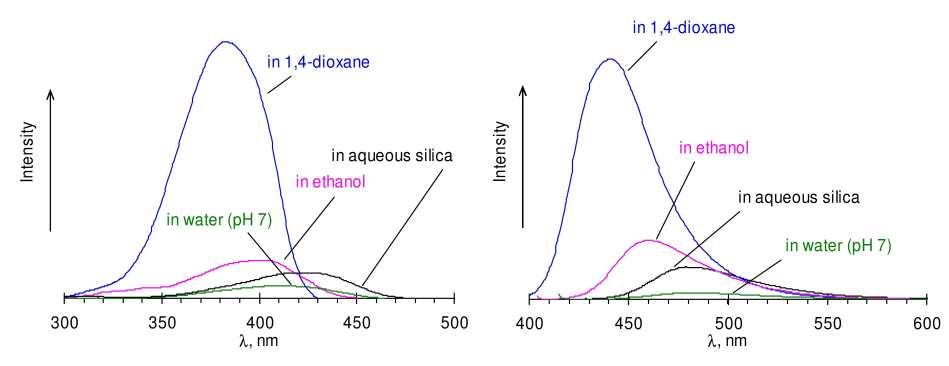 Fig. 2. The excitation and emission spectra of Q-N2 solutions in water (λex=411 nm), ethanol (λex=400 nm), 1,4-dioxane (λex=383 nm), and aqueous silica nanoparticles (20 mM, condensed at pH 5.5, λex=419 nm). Monochromator slits was 4 (input) and 4 (output) nm. Q-N2 сoncentration in solutions was 3 μM. Emission is presented with spectral correction due to flat response of the detection channel in the measured spectral range.
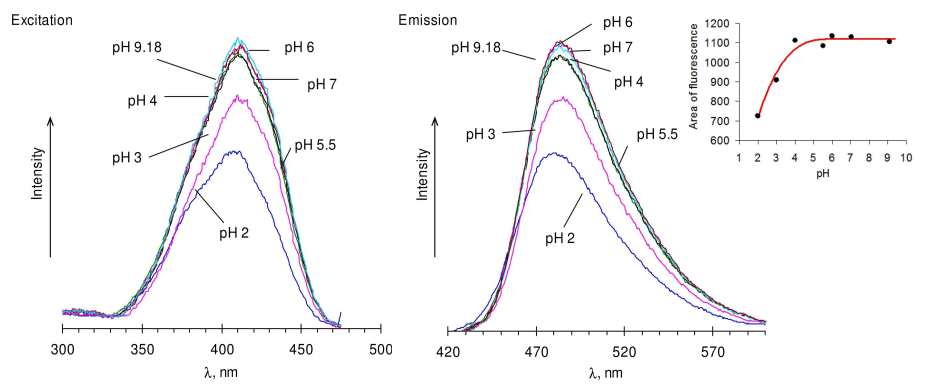 Fig. 3. The excitation and emission spectra of Q-N2 in buffer solutions at various pH values and area under the fluorescence curve vs. pH for Q-N2 solutions. Excitation λex=410 nm, monochromator slits were 4 (input) and 4 (output) nm. Concentration of Q-N2 in solutions was 3 μM.
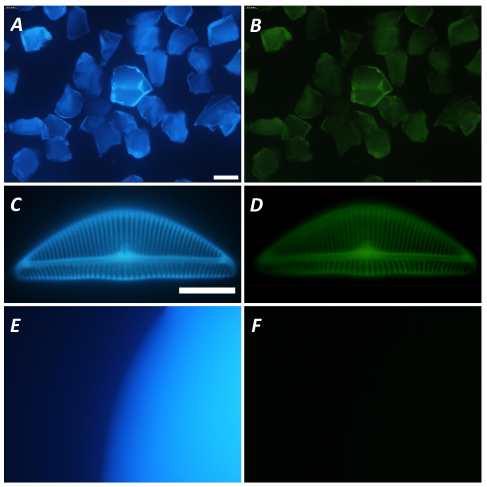 Fig. 4. The emittance photos of Q-N2 dye supported on silica gel - A and B, incorporated into Encyonema sp. frustules - C and D, and in a solution - E and F. 365 (A, C and E) and 470 nm (B, D and F) long pass excitation filters were applied. Exposure 20 ms for A-E, 200 ms for F. Scalebar: A-B - 100 μm, C-D - 10 μm.
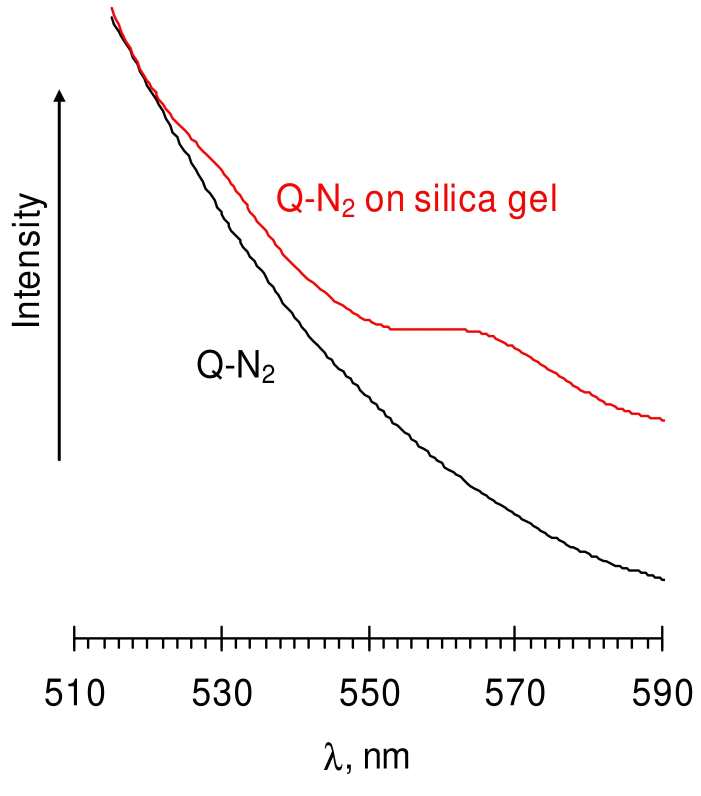 Fig. 5. Emission spectra of Q-N2 in water (3 µM) and on Q-N2 adsorbed onto silica gel at excitation 470 nm. The width of monochromator slits was 15 (input) and 10 (output) nm.
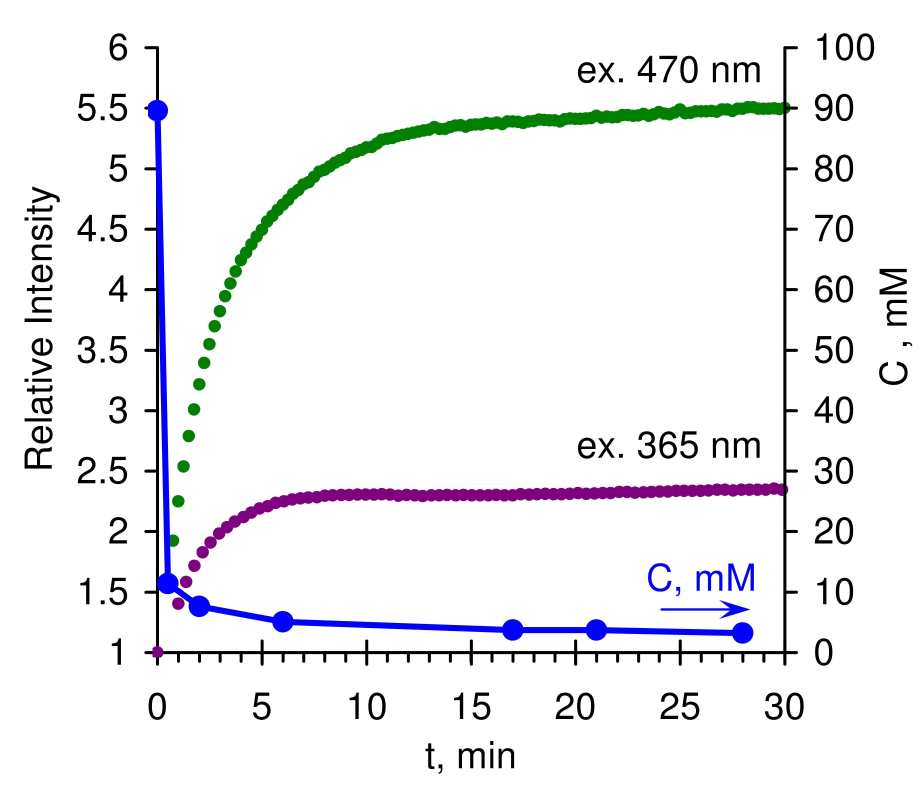 Fig. 6. Time dependence of fluorescence intensity excited at 365 and 470 nm and concentration of molybdate-reactive silicic acid under silicic acid condensation at pH 7. Emission was recorded at 480 and 530 nm. Initial silicic acid concentration - 90 mM, Q-N2 concentration - 8 μM.
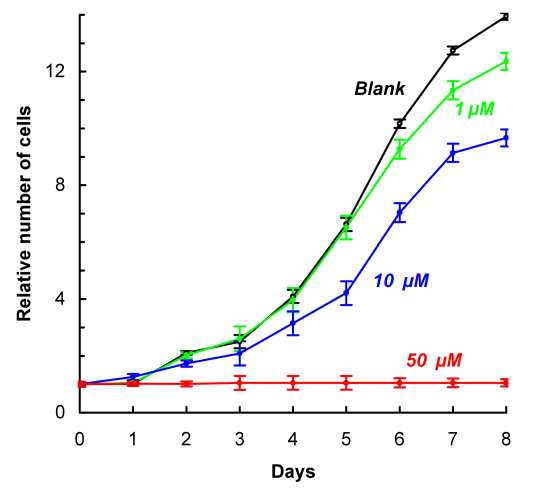 Fig. 7. Growth curves of U. ferefusiformis in the presence of Q-N2 dye. Concentration of the dye is presented near curves.
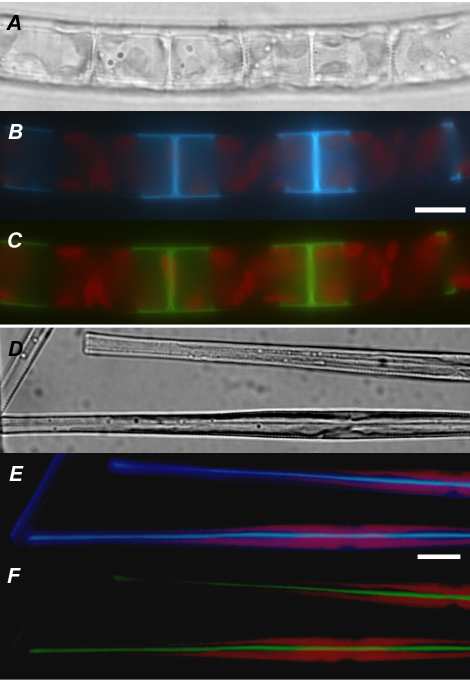 Fig. 8. Optical (A and D) and fluorescent (B, C, E and F) microphotographs of the diatoms Aulacoseira sp. (A-C) and U. ferefusiformis (D-F) after 24 h cultivation in the presence of 0.5 μM Q-N2. Blue and green fluorescence - siliceous valves and red fluorescence - chloroplasts. 365 (B and E) and 470 nm (C and F) long pass excitation filters were applied. Scale bars represent 10 μm.
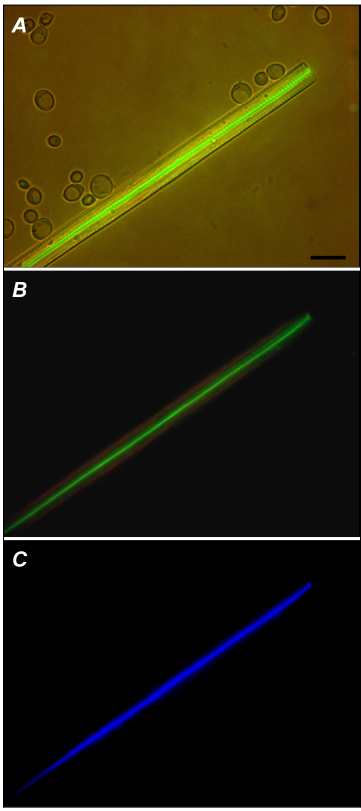 Figure 9. The main stages of spiculogenesis in L. baicalensis. 1 – silicon accumulation in sclerocyte; 2, 3 – formation of organic filament and protrusion of the new spicule from the cell; 4 – further elongation of the filament, sclerocyte capture silicic acid and organic substances from the extracellular space which allows further growth of the spicule; 5, 6 – new sclerocytes merge with the growing spicule and a mature spicule (7) is obtained.
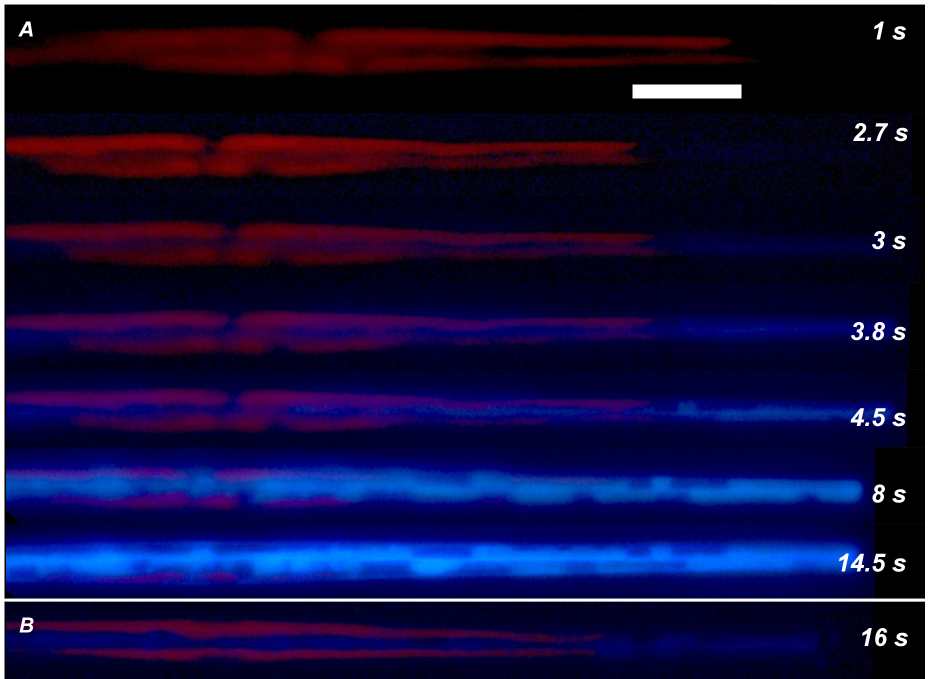 Fig. 10. Fluorescence microscopy images of U. ferefusiformis cells growing after the addition of silicic acid (100 μM) and Q-N2 (0.5 μM) to the synchronized culture (A) and after addition of Q-N2 only (B). Time after the replenishment of silicic acid is presented near images. Red fluorescence comes from chloroplasts, blue - from Q-N2 in cytoplasm, and cyan - from condensed siliceous particles stained with Q-N2. 365 long pass excitation filter was applied. Scale bar represents 10 μm.