.
Oven
Amine1
Vadim V. Annenkov, Elena N. Danilovtseva. 2016. Spiculogenesis in the siliceous sponge Lubomirskia baicalensis studied with fluorescent staining. Journal of Structural Biology. V. 194, Is. 1, P. 29-37. doi:10.1016/j.jsb.2016.01.010 (IF= 3.231)
Siliceous sponges are the most primitive multicellular animals whose skeleton consists of spicules - needle-like constructions from silicon dioxide surrounding organic axial filaments. Mechanisms of spicule formation have been intensively studied due to the high ecological importance of sponges and their interest to materials science. Light and electron microscopy are not appropriate enough to display the process from silicon-enriched cells to mature spicules because of composite structure of the sponge tissues. In this article, spiculogenesis in the siliceous sponge has been studied for the first time with the use of fluorescent microscopy. Fluorescent vital dye NBD-N2 was applied to stain growing siliceous structures in the sponge and primmorph cell system. The main stages of spicule growth in the fresh-water sponge Lubomirskia baicalensis (Pallas, 1773) were visualized: silicon accumulation in sclerocytes; formation of an organic filament protruding from the cell; further elongation of the filament and growth of the spicule in a spindle-like form with enlargement in the center; merger with new sclerocytes and formation of the mature spicule. Fluorescent microscopy combined with SEM allows us to overcome the virtual differentiation between intra- and extracellular mechanisms of spicule growth. The growing spicule can capture silicic acid from the extracellular space and merge with new silicon-enriched cells. Visualization of the growing spicules with the fluorescent dye allows us to monitor sponge viability in ecological or toxicological experiments and to apply genomic, proteomic and biochemical techniques.
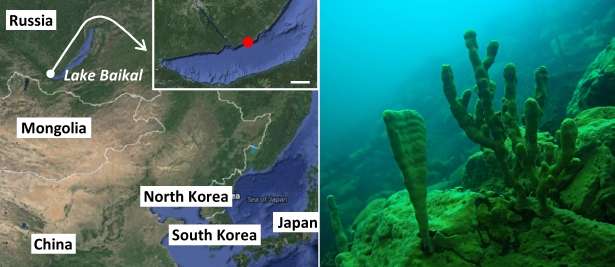 Fig. 1. Left: a map showing location of the Lake Baikal and sampling place (red circle). The map was obtained from the Google Maps, scale bar represents 20 km. Right: branches of the L. baicalensis sponges at the bottom of the Lake Baikal (picture from I. Khanaev).
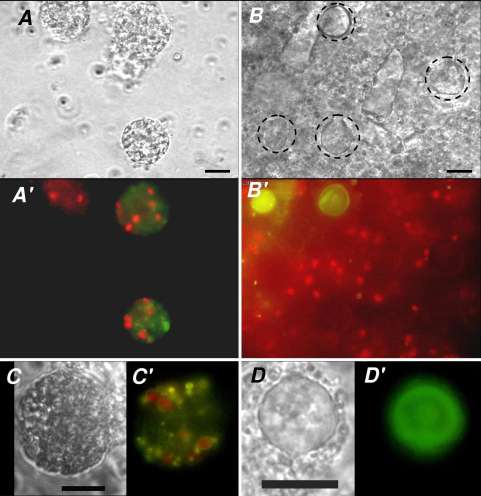
Fig. 2. Light (A, B, C and D), fluorescent (A', B', C' and D') and SEM (E) images of cells in L. baicalensis primmorphs after 4 (A, A', C and C) and 48 (B, B', D, D' and E) hours after addition of NBD-N2 dye into culture medium. Green fluorescence corresponds to NBD-N2 dye, red – to chlorophyll in symbionts. Dotted circles (A and B) point on sponge cells which are not stained with NBD-N2. Red color on the SEM images corresponds to silicon mapping (EDAX). Scale bars represent 10 µm. oC.
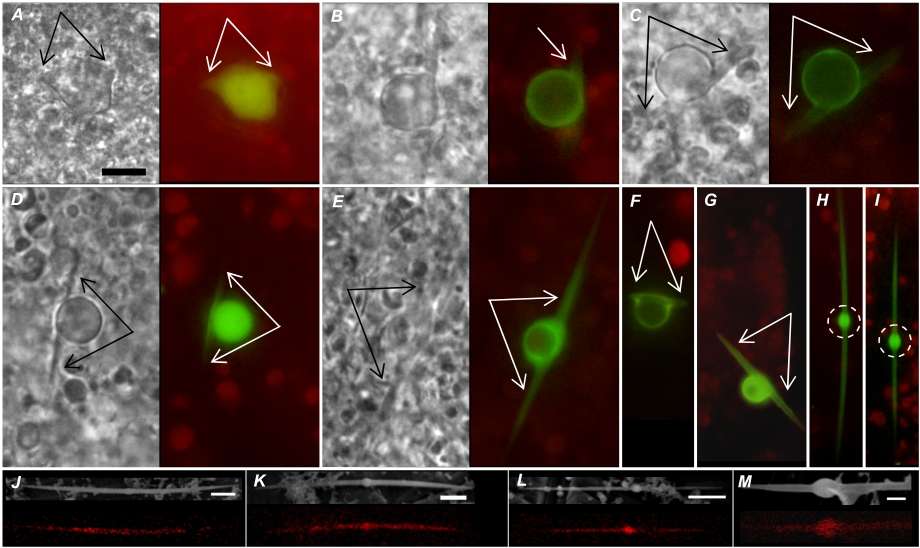 Fig. 3. Representative light (left gray images) and fluorescent (A–I), SEM and EDAX Si-mapping (J–M) images of the initial stage of spiculogenesis in L. baicalensis primmorphs growing in the presence of NBD-N2. Green fluorescence corresponds to NBD-N2 dye, red – to chlorophyll in symbionts. Red color on the SEM images corresponds to silicon mapping (EDAX). Arrows (A–G) point on protrusions which elongates along the axis of new spicule. Dotted circles (H and I) point on a bright bulb in the center of immature spicule. A thin non-fluorescent axial canal is visible on H and I images. Scale bars represent 10 (A–I) and 2 (J–M) µm, magnification is equal for A–I images.
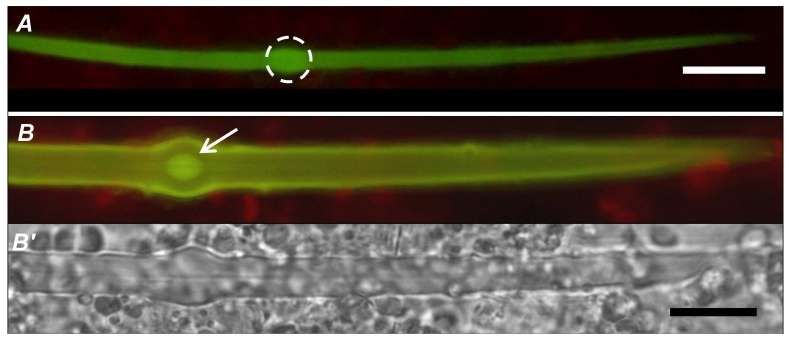 Fig. 4. Representative fluorescent (A and B) and light (B') images of growing spicules in L. baicalensis primmorphs in the presence of NBD-N2. Green fluorescence corresponds to NBD-N2 dye, red – to chlorophyll in symbionts. Image A shows resolving of the central bulb (marked with a dotted circle) and image B shows formation of a new silica layer around primary needle-like structure and a central bulb (marked an arrow). Scale bars represent 10 µm.
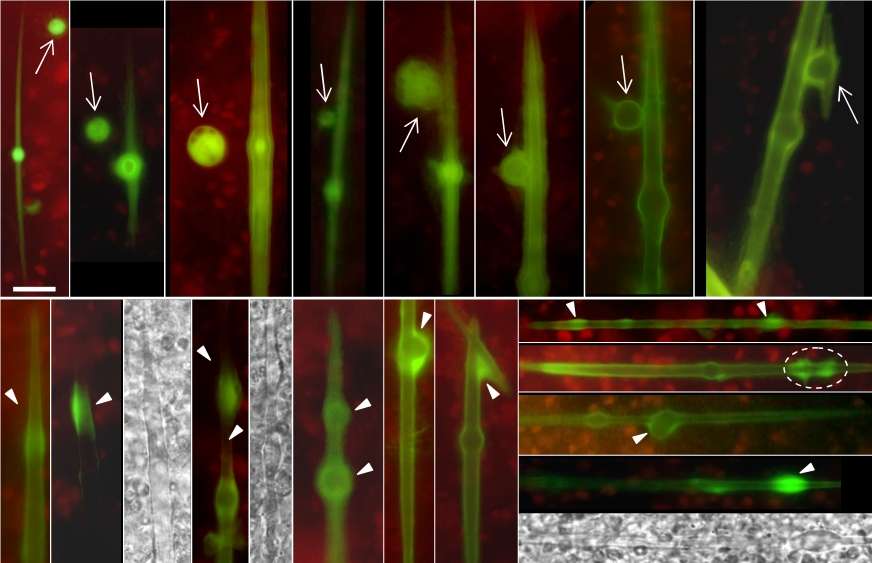 Fig. 5. Light and fluorescent images of growing spicules in L. baicalensis primmorphs which demonstrate participation of additional sclerocytes. Green fluorescence corresponds to NBD-N2 dye, red – to chlorophyll in symbionts, grey images were obtained with light microscopy. The top row corresponds to sclerocytes (arrow marked) which come to growing spicules and merge with them. Images from the bottom row were obtained after two weeks cultivation in the presence of the NBD-N2 dye with three months age primmorphs. These images show “dappled” spicules, containing fluorescent regions (triangle marked) where NBD-N2-filled sclerocytes merged with growing spicules. Scale bar represents 10 µm for all pictures.
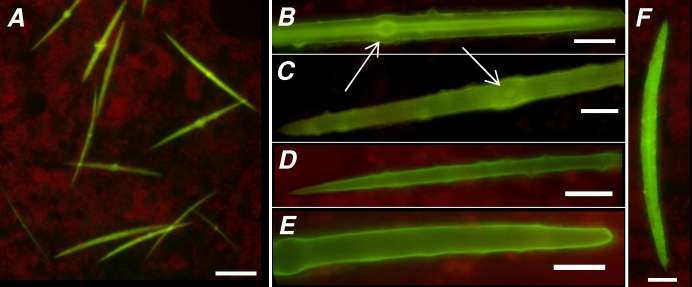 Figure 6. Fluorescent images of the spicules in L. baicalensis primmorphs in the final stage of growth in the presence of NBD-N2 dye (green fluorescence). Image A represents a primmorph after five months cultivation demonstrating spicules in various stages of growth. Images B and C show near full-size spicules containing the initial needle-like fluorescent structures with a bright bulb in the center (marked with arrows). Images D and E were obtained at two weeks after addition of NBD-N2 to the medium of a three months age culture. A thin, near 1 µm stained surface layer corresponds to silica layer deposited during this two weeks. Image F represents full-stained mature spicule which was observed after three months of the primmorph growth. Scale bars represent 50 (A) and 20 (B–F) µm.
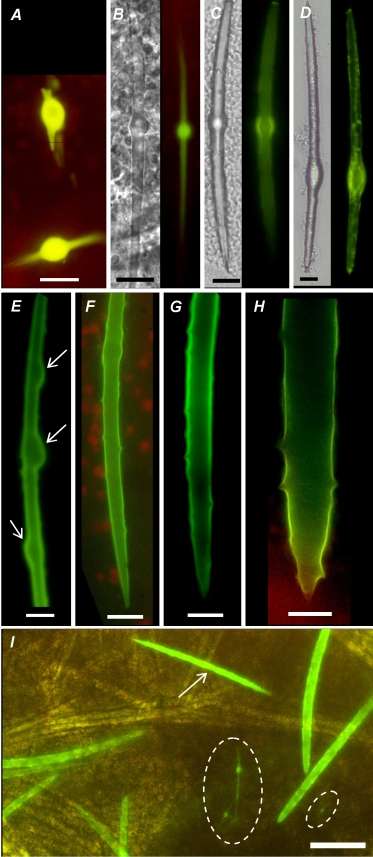 Figure 7. Light and fluorescent images of the spicules in L. baicalensis sponge after two weeks growth in the presence of NBD-N2 dye. Green fluorescence corresponds to NBD-N2 dye, red – to chlorophyll in symbionts, grey images were obtained with light microscopy. Images A and B show initial stage of the spicule formation similar to presented on Fig. 3 for primmorphs. Images C–E correspond to merging of sclerocytes with growing spicules which results in fluorescent bubbles (C and D) or several bulbous structures along a spicule (E, white arrows). Images E–H contain thin stained surface layer corresponds to silica deposited during sponge growth in the presence of NBD-N2 dye, similar to presented on Fig. 6D and E for primmorphs. Image (I) was obtained by combining light illumination and fluorescent excitation which allows us to see simultaneously old non-fluorescent spicules, initial spicules (marked with a dotted circles), young fluorescent spicule (arrow marked) and new mature not fully stained spicules. Scale bars represent 10 (A–H) and 50 (I) µm.
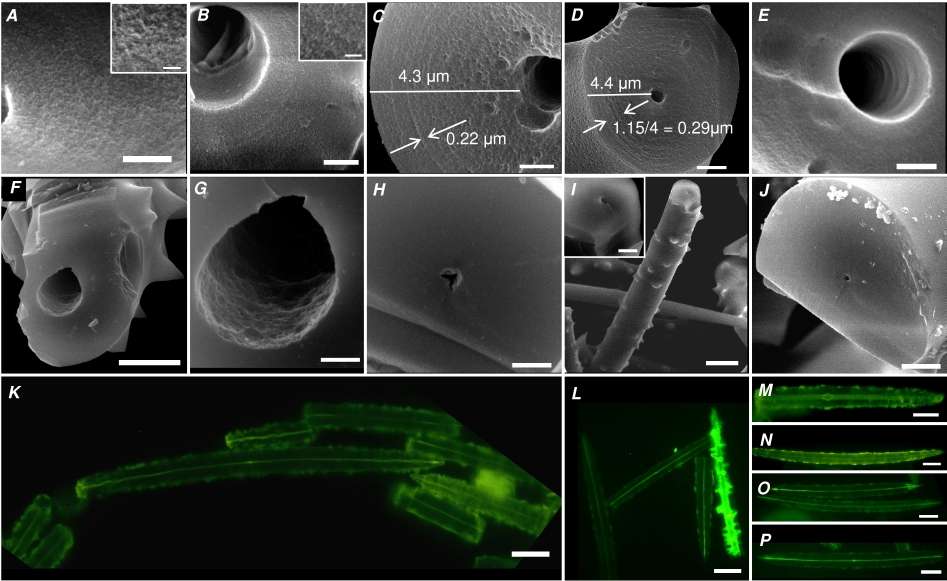 Figure 8. Images of L. baicalensis spicules after removing of organic substances by means of NaOCl treatment. SEM data (A–J) were obtained after additional HF etching, samples C and D were heated at 600 °C for 2 h before HF action. Images A and B show morphology of the sponge silica; thin axial canals are presented on D and H–J pictures; thick canals are shown on B, C and E–G images. Concentric layered structure is visible on C and D images as well as spicule radius and thickness of the silica layers. Fluorescent images (K–P) were obtained after staining with NBD-N5 dye ( Annenkov et al., 2015). These data show thin axial fluorescent canals and two spicules (L and M) contain thick canals. Scale bars represent 200 nm (insertion in A and B), 1 (C, E, G and H), 2 (A, B, D, J and insertion in I), 5(F), 10 (I) and 20 (K–P) µm.
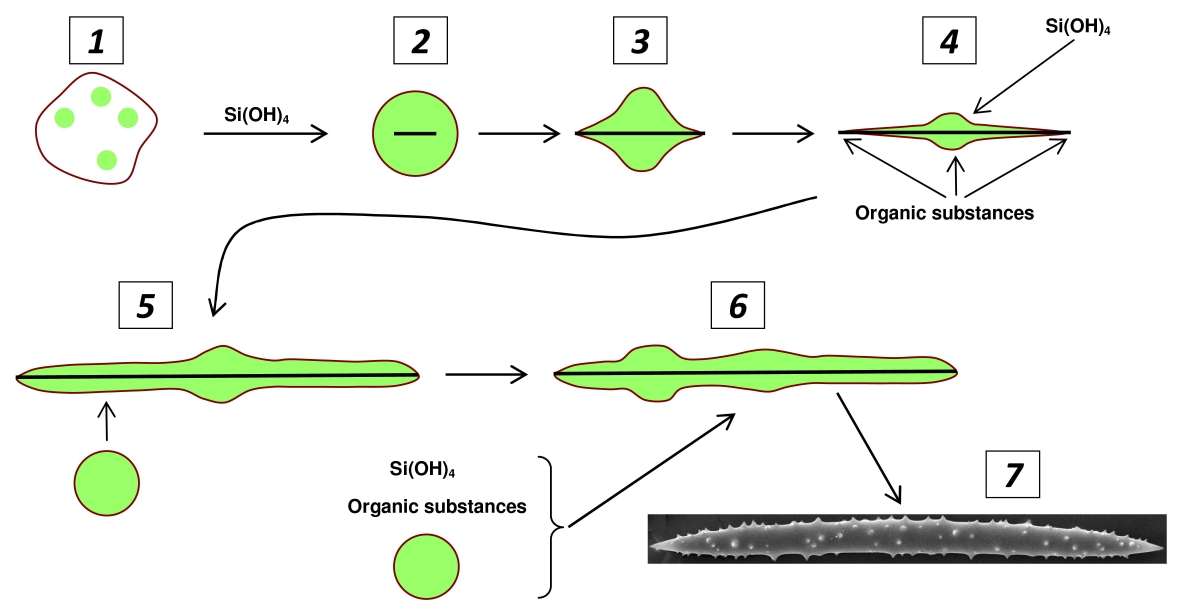 Figure 9. The main stages of spiculogenesis in L. baicalensis. 1 – silicon accumulation in sclerocyte; 2, 3 – formation of organic filament and protrusion of the new spicule from the cell; 4 – further elongation of the filament, sclerocyte capture silicic acid and organic substances from the extracellular space which allows further growth of the spicule; 5, 6 – new sclerocytes merge with the growing spicule and a mature spicule (7) is obtained.