.
Oven
Amine1
Danilovtseva E.N., Aseyev V., Belozerova O.Yu., Zelinskiy S.N., Annenkov V.V. 2015. Bioinspired thermo- and pH-responsive polymeric amines: multimolecular aggregates in aqueous media and matrices for silica/polymer nanocomposites. Journal of Colloid and Interface Science 446:1-10. DOI:10.1016/j.jcis.2015.01.02 (IF= 3,552)
Polymeric amines have been intensively studied for application in smart systems and as matrices for the design of composite materials, including bioinspired substances. A new thermo- and pH-responsive polymer was obtained by radical polymerization of N-(3-(diethylamino)propyl)-N-methylacrylamide. Upon heating, the polymer precipitated from aqueous solutions above pH 9; the observed cloud point was dependent on the polymer concentration and decreased from 95 oC at pH 9 to 40 oC at pH 11. The basicity of the polymer decreased at elevated temperatures owing to an increase in the hydrophobicity-driven compaction of the macromolecules. Dynamic light scattering analysis demonstrated that the formation of large multimolecular associates with radius 1000-2000 nm was initiated from 1-2 oC below the cloud point. The new polymer is demonstrated to be an effective matrix for various siliceous composite structures, including 200-300 nm solid spherical raspberry-like particles and hollow hemispherical particles of more than 1000 nm diameter. Condensation of silicic acid in the presence of polymeric amines is a model reaction in biosilicification studies, and the obtained data are also discussed from the perspective of the matrix hypothesis for biosilica formation.
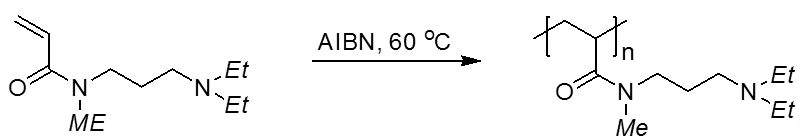 Fig. 1. Scheme for PDEAPMA synthesis.
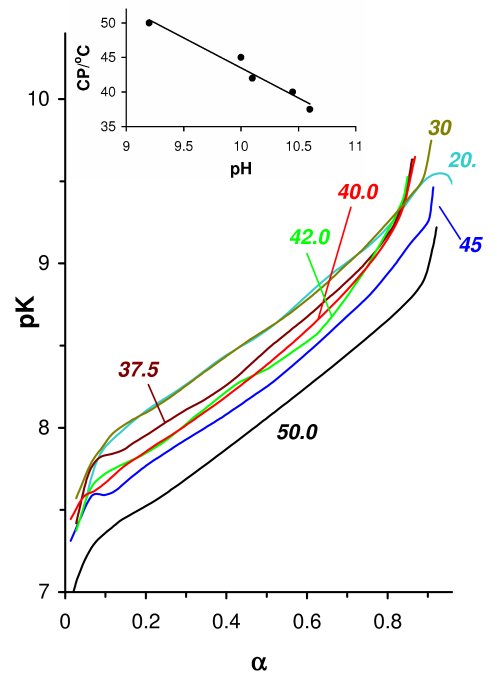
Fig. 2. Potentiometric titration data presented as pK vs. the degree of ionization (α) of the conjugated acid (PDEAPMA concentration = 10 mM (2 mg/mL)). The numerical labels on each curve indicate the temperature of the solutions during titration. The inset shows the dependence of the cloud point temperature (CP) on the pH determined by potentiometric titration. The CP of pH 9 polymer solutions observed upon heating was 95 oC.
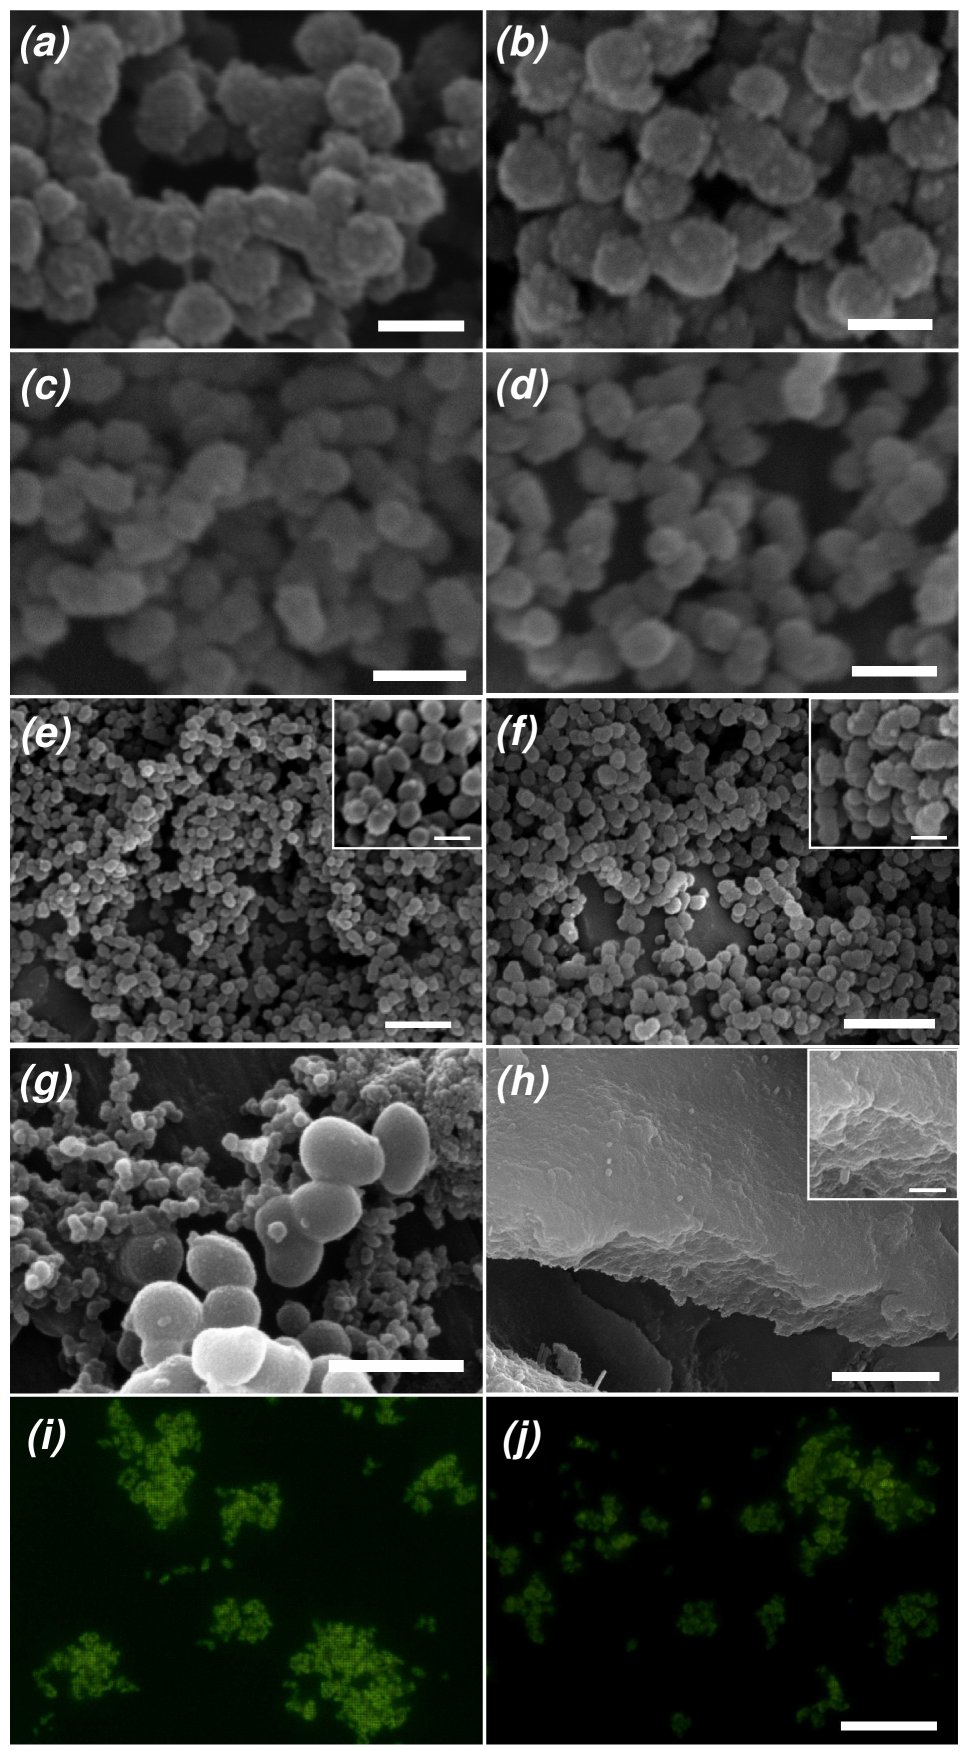 Fig. 4. SEM and fluorescence images of silica/PDEAPMA precipitates obtained by condensation of silicic acid produced from sodium silicate in the presence of PDEAPMA (polymer concentration: 10 mM; sodium silicate concentration: 20 mM (a and c-f), 30 mM (b and g), and 40 mM (h); pH of the precipitation reaction: 10 (a-d and g) and 8 (e, f and h). All experiments, except (g), were conducted by mixing solutions of sodium silicate and PDEAPMA, followed by pH adjustment to the desired value. Experiment (g) was conducted by independently adjusting the pH of 20 mM PDEAPMA and 60 mM sodium silicate solutions to 10, followed by mixing the solutions after a 3 min delay. In the case of experiments (e) and (f), the pH was quickly adjusted to 10, followed by a 3 min delay; additional HCl was added to adjust the pH to 8. Reaction temperature: 25 oC (a and b), 45 oC (e and g), and 60 oC (f and h). Samples (c) and (d) were obtained after 2 h of calcination of sample (a) at 550 (c) followed by 2 h calcination at 800 oC (d); (i) and (j): fluorescence images of the composite precipitates (c) and (d), respectively, after staining with NBD-N3. Scale bar: 500 nm (a-d, insertions in e and f), 1 µm (g and insertion in h), 2 µm (e and f), and 5 µm (f), 10 µm (i and j).
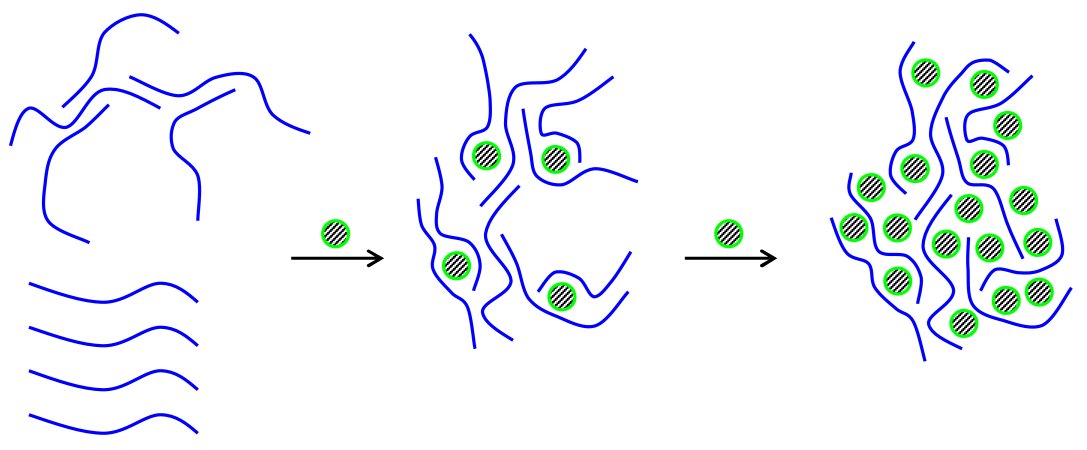 Fig. 6. Schematic representation of the interaction of PDEAPMA (lines) with oligosilicate nanoparticles (filled circles) at pH 10.
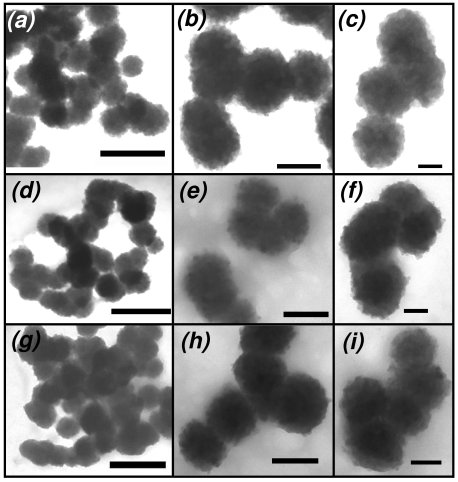 Fig. 7. TEM images of composite precipitates obtained by the condensation of silicic acid (produced from sodium silicate) in the presence of PDEAPMA (polymer concentration: 10 mM; sodium silicate concentration: 20 mM; pH of the precipitation reaction: 10; and reaction temperature: 25 oC. Samples (e-h) and (i-l) were obtained by calcination of the initial sample (a-d) at 550 and 800 oC, respectively, for 2 h. Scale bar: 500 nm (a, e, and i), 200 (b, f, and j), and 100 nm (c, d, g, h, k and l).
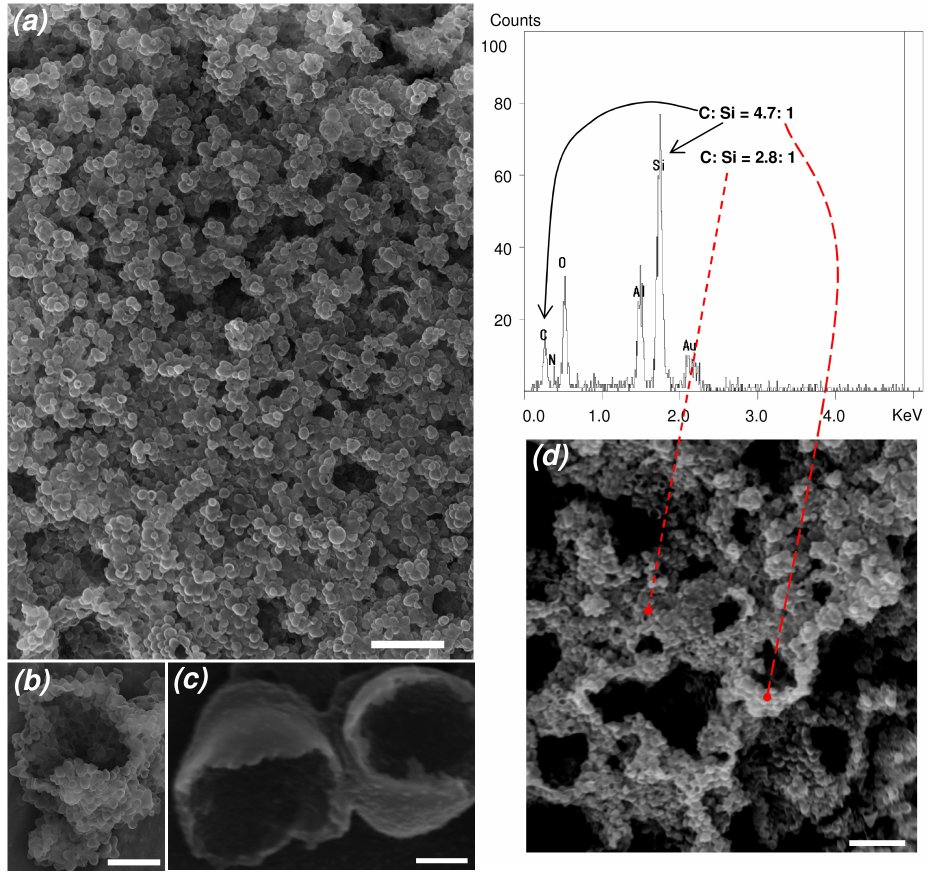 Figure 8. SEM images and SEM-XEPMA data of composite precipitates obtained by the condensation of silicic acid (produced from TMOS) in the presence of PDEAPMA. Scale bars represent 10 (a, b, and d) and 0.5 (c) µm.